Immigrants from Japan vs Hispanic or Latino Unemployment Among Women with Children Under 6 years
COMPARE
Immigrants from Japan
Hispanic or Latino
Unemployment Among Women with Children Under 6 years
Unemployment Among Women with Children Under 6 years Comparison
Immigrants from Japan
Hispanics or Latinos
6.5%
UNEMPLOYMENT AMONG WOMEN WITH CHILDREN UNDER 6 YEARS
100.0/ 100
METRIC RATING
27th/ 347
METRIC RANK
9.0%
UNEMPLOYMENT AMONG WOMEN WITH CHILDREN UNDER 6 YEARS
0.0/ 100
METRIC RATING
302nd/ 347
METRIC RANK
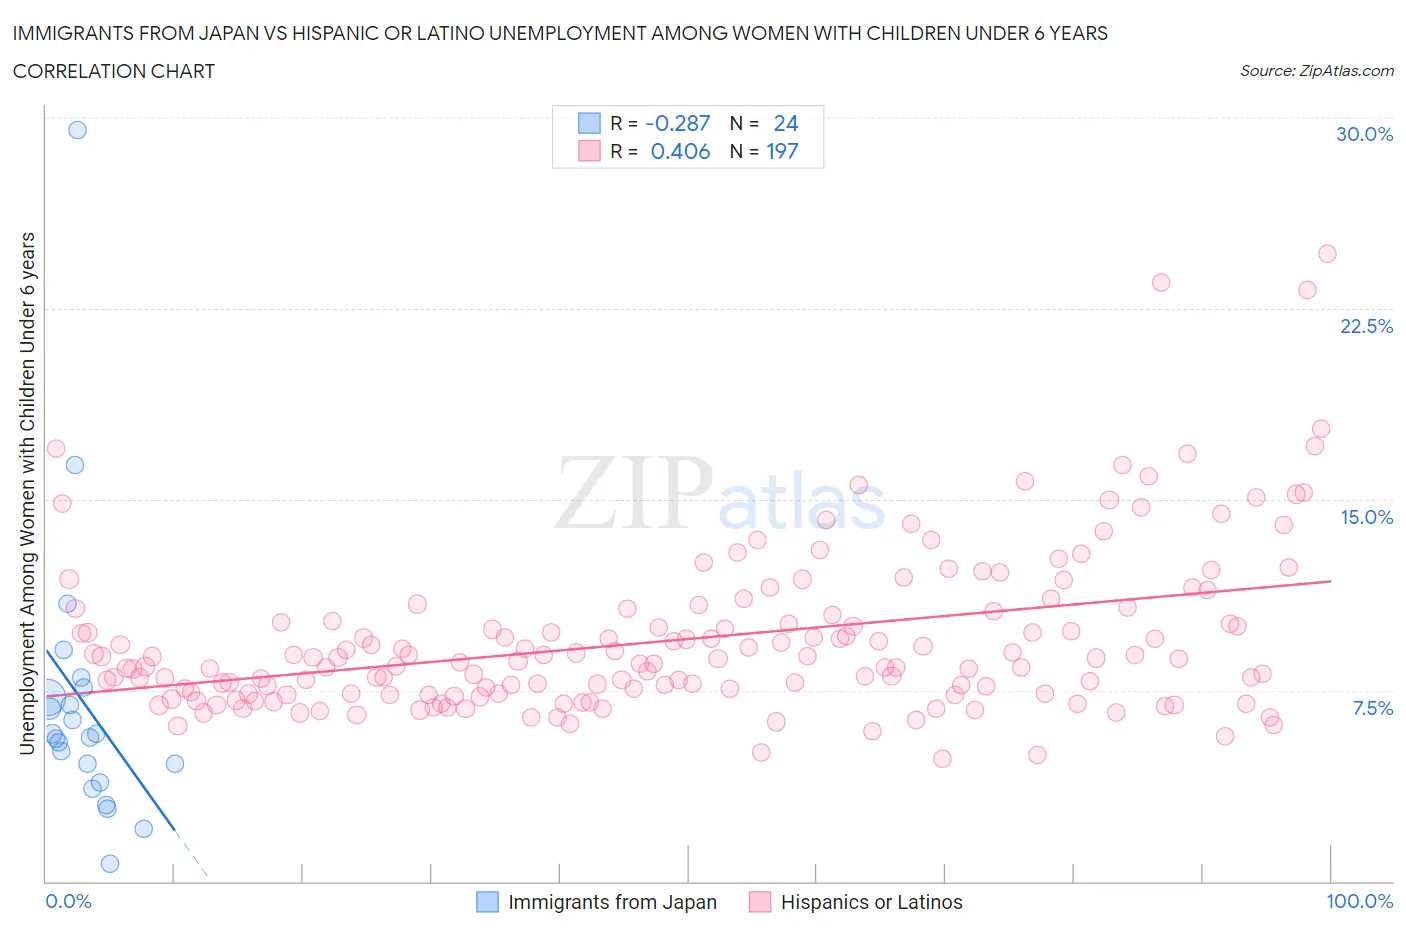
Immigrants from Japan vs Hispanic or Latino Unemployment Among Women with Children Under 6 years Correlation Chart
The statistical analysis conducted on geographies consisting of 268,694,372 people shows a weak negative correlation between the proportion of Immigrants from Japan and unemployment rate among women with children under the age of 6 in the United States with a correlation coefficient (R) of -0.287 and weighted average of 6.5%. Similarly, the statistical analysis conducted on geographies consisting of 378,793,186 people shows a moderate positive correlation between the proportion of Hispanics or Latinos and unemployment rate among women with children under the age of 6 in the United States with a correlation coefficient (R) of 0.406 and weighted average of 9.0%, a difference of 38.2%.
Unemployment Among Women with Children Under 6 years Correlation Summary
| Measurement | Immigrants from Japan | Hispanic or Latino |
| Minimum | 0.70% | 4.8% |
| Maximum | 29.5% | 24.7% |
| Range | 28.8% | 19.9% |
| Mean | 7.0% | 9.5% |
| Median | 5.7% | 8.7% |
| Interquartile 25% (IQ1) | 4.3% | 7.4% |
| Interquartile 75% (IQ3) | 7.4% | 10.5% |
| Interquartile Range (IQR) | 3.2% | 3.2% |
| Standard Deviation (Sample) | 5.7% | 3.2% |
| Standard Deviation (Population) | 5.6% | 3.2% |
Similar Demographics by Unemployment Among Women with Children Under 6 years
Demographics Similar to Immigrants from Japan by Unemployment Among Women with Children Under 6 years
In terms of unemployment among women with children under 6 years, the demographic groups most similar to Immigrants from Japan are Immigrants from Israel (6.5%, a difference of 0.020%), Cypriot (6.5%, a difference of 0.10%), Soviet Union (6.5%, a difference of 0.18%), Laotian (6.5%, a difference of 0.20%), and Immigrants from Sweden (6.6%, a difference of 0.28%).
| Demographics | Rating | Rank | Unemployment Among Women with Children Under 6 years |
| Ute | 100.0 /100 | #20 | Exceptional 6.5% |
| Burmese | 100.0 /100 | #21 | Exceptional 6.5% |
| Immigrants | Korea | 100.0 /100 | #22 | Exceptional 6.5% |
| Bulgarians | 100.0 /100 | #23 | Exceptional 6.5% |
| Laotians | 100.0 /100 | #24 | Exceptional 6.5% |
| Soviet Union | 100.0 /100 | #25 | Exceptional 6.5% |
| Cypriots | 100.0 /100 | #26 | Exceptional 6.5% |
| Immigrants | Japan | 100.0 /100 | #27 | Exceptional 6.5% |
| Immigrants | Israel | 100.0 /100 | #28 | Exceptional 6.5% |
| Immigrants | Sweden | 100.0 /100 | #29 | Exceptional 6.6% |
| Immigrants | Belarus | 100.0 /100 | #30 | Exceptional 6.6% |
| Immigrants | Moldova | 100.0 /100 | #31 | Exceptional 6.6% |
| Tsimshian | 100.0 /100 | #32 | Exceptional 6.6% |
| Immigrants | Vietnam | 100.0 /100 | #33 | Exceptional 6.6% |
| Immigrants | South Central Asia | 100.0 /100 | #34 | Exceptional 6.6% |
Demographics Similar to Hispanics or Latinos by Unemployment Among Women with Children Under 6 years
In terms of unemployment among women with children under 6 years, the demographic groups most similar to Hispanics or Latinos are Immigrants from West Indies (9.0%, a difference of 0.030%), Immigrants from Mexico (9.1%, a difference of 0.17%), Alaskan Athabascan (9.1%, a difference of 0.58%), Pueblo (9.1%, a difference of 0.76%), and Dominican (9.1%, a difference of 0.87%).
| Demographics | Rating | Rank | Unemployment Among Women with Children Under 6 years |
| Immigrants | Central America | 0.0 /100 | #295 | Tragic 8.9% |
| Immigrants | Dominican Republic | 0.0 /100 | #296 | Tragic 8.9% |
| Mexicans | 0.0 /100 | #297 | Tragic 8.9% |
| Tlingit-Haida | 0.0 /100 | #298 | Tragic 8.9% |
| Immigrants | Jamaica | 0.0 /100 | #299 | Tragic 8.9% |
| Creek | 0.0 /100 | #300 | Tragic 8.9% |
| Chickasaw | 0.0 /100 | #301 | Tragic 9.0% |
| Hispanics or Latinos | 0.0 /100 | #302 | Tragic 9.0% |
| Immigrants | West Indies | 0.0 /100 | #303 | Tragic 9.0% |
| Immigrants | Mexico | 0.0 /100 | #304 | Tragic 9.1% |
| Alaskan Athabascans | 0.0 /100 | #305 | Tragic 9.1% |
| Pueblo | 0.0 /100 | #306 | Tragic 9.1% |
| Dominicans | 0.0 /100 | #307 | Tragic 9.1% |
| Immigrants | Micronesia | 0.0 /100 | #308 | Tragic 9.1% |
| Africans | 0.0 /100 | #309 | Tragic 9.2% |