French vs Immigrants from Philippines Unemployment Among Women with Children Under 6 years
COMPARE
French
Immigrants from Philippines
Unemployment Among Women with Children Under 6 years
Unemployment Among Women with Children Under 6 years Comparison
French
Immigrants from Philippines
8.2%
UNEMPLOYMENT AMONG WOMEN WITH CHILDREN UNDER 6 YEARS
1.7/ 100
METRIC RATING
244th/ 347
METRIC RANK
7.5%
UNEMPLOYMENT AMONG WOMEN WITH CHILDREN UNDER 6 YEARS
71.3/ 100
METRIC RATING
159th/ 347
METRIC RANK
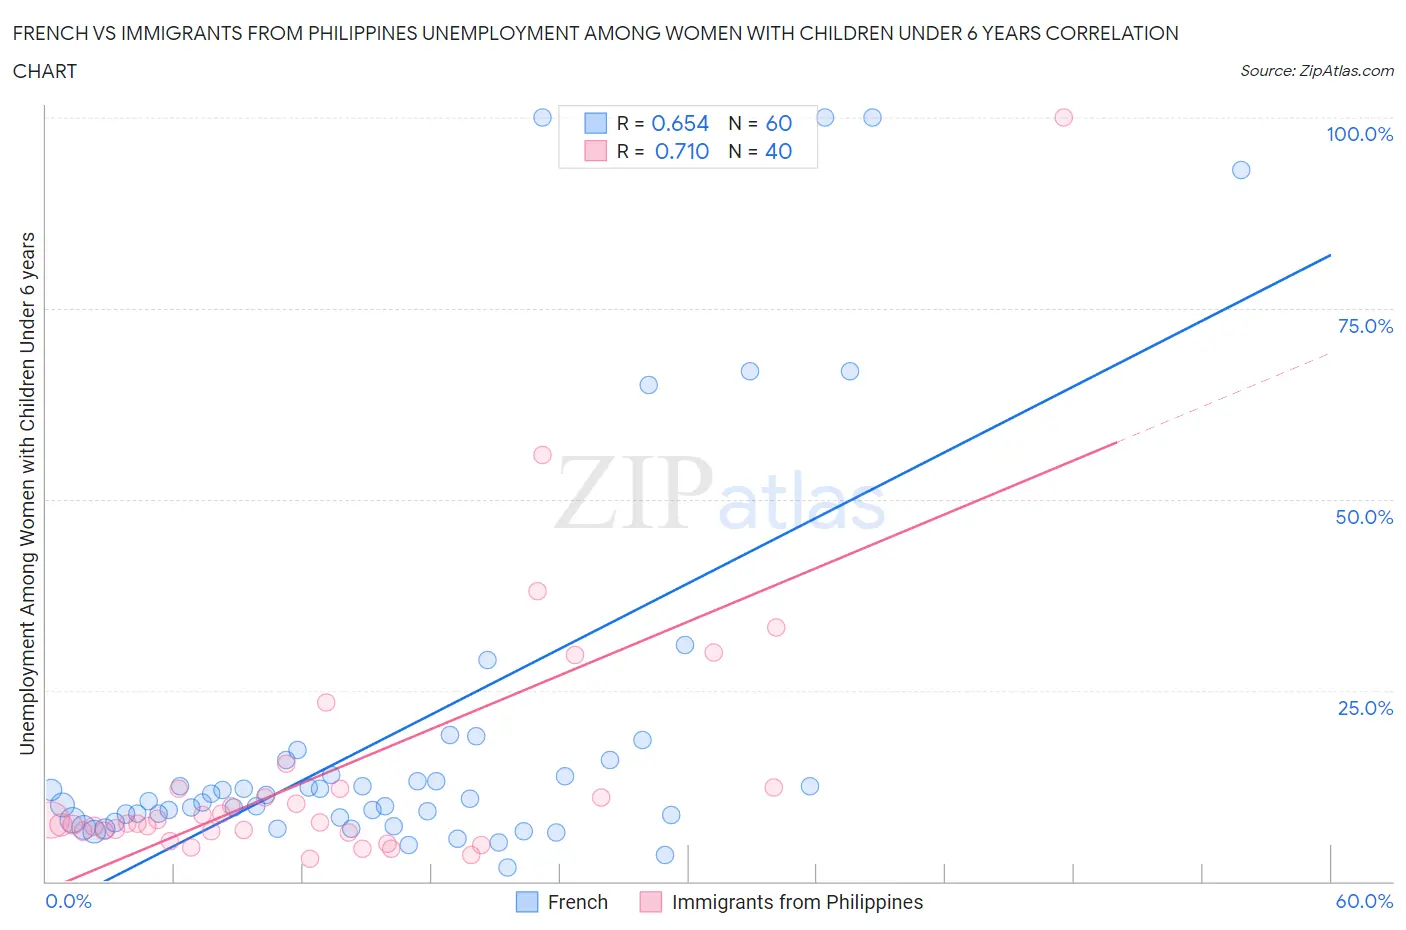
French vs Immigrants from Philippines Unemployment Among Women with Children Under 6 years Correlation Chart
The statistical analysis conducted on geographies consisting of 377,570,296 people shows a significant positive correlation between the proportion of French and unemployment rate among women with children under the age of 6 in the United States with a correlation coefficient (R) of 0.654 and weighted average of 8.2%. Similarly, the statistical analysis conducted on geographies consisting of 343,754,489 people shows a strong positive correlation between the proportion of Immigrants from Philippines and unemployment rate among women with children under the age of 6 in the United States with a correlation coefficient (R) of 0.710 and weighted average of 7.5%, a difference of 8.3%.
Unemployment Among Women with Children Under 6 years Correlation Summary
| Measurement | French | Immigrants from Philippines |
| Minimum | 1.8% | 3.0% |
| Maximum | 100.0% | 100.0% |
| Range | 98.2% | 97.0% |
| Mean | 19.6% | 14.1% |
| Median | 10.7% | 7.6% |
| Interquartile 25% (IQ1) | 8.1% | 6.5% |
| Interquartile 75% (IQ3) | 14.9% | 12.1% |
| Interquartile Range (IQR) | 6.8% | 5.5% |
| Standard Deviation (Sample) | 24.9% | 17.7% |
| Standard Deviation (Population) | 24.7% | 17.5% |
Similar Demographics by Unemployment Among Women with Children Under 6 years
Demographics Similar to French by Unemployment Among Women with Children Under 6 years
In terms of unemployment among women with children under 6 years, the demographic groups most similar to French are Native Hawaiian (8.2%, a difference of 0.010%), Hawaiian (8.2%, a difference of 0.030%), Central American (8.2%, a difference of 0.34%), Dutch (8.1%, a difference of 0.59%), and German Russian (8.2%, a difference of 0.61%).
| Demographics | Rating | Rank | Unemployment Among Women with Children Under 6 years |
| Immigrants | Costa Rica | 4.1 /100 | #237 | Tragic 8.0% |
| Immigrants | Middle Africa | 3.2 /100 | #238 | Tragic 8.1% |
| Irish | 2.7 /100 | #239 | Tragic 8.1% |
| Immigrants | El Salvador | 2.6 /100 | #240 | Tragic 8.1% |
| Liberians | 2.6 /100 | #241 | Tragic 8.1% |
| Dutch | 2.5 /100 | #242 | Tragic 8.1% |
| Hawaiians | 1.8 /100 | #243 | Tragic 8.2% |
| French | 1.7 /100 | #244 | Tragic 8.2% |
| Native Hawaiians | 1.7 /100 | #245 | Tragic 8.2% |
| Central Americans | 1.4 /100 | #246 | Tragic 8.2% |
| German Russians | 1.2 /100 | #247 | Tragic 8.2% |
| Immigrants | Western Africa | 1.1 /100 | #248 | Tragic 8.2% |
| Immigrants | Sierra Leone | 1.1 /100 | #249 | Tragic 8.2% |
| Nigerians | 1.1 /100 | #250 | Tragic 8.2% |
| Guyanese | 1.0 /100 | #251 | Tragic 8.2% |
Demographics Similar to Immigrants from Philippines by Unemployment Among Women with Children Under 6 years
In terms of unemployment among women with children under 6 years, the demographic groups most similar to Immigrants from Philippines are Bolivian (7.5%, a difference of 0.040%), Croatian (7.5%, a difference of 0.050%), Peruvian (7.5%, a difference of 0.080%), Immigrants from Western Asia (7.5%, a difference of 0.080%), and Immigrants from Southern Europe (7.5%, a difference of 0.17%).
| Demographics | Rating | Rank | Unemployment Among Women with Children Under 6 years |
| Bangladeshis | 74.8 /100 | #152 | Good 7.5% |
| Uruguayans | 74.7 /100 | #153 | Good 7.5% |
| Northern Europeans | 74.3 /100 | #154 | Good 7.5% |
| South Americans | 74.1 /100 | #155 | Good 7.5% |
| Immigrants | Southern Europe | 73.2 /100 | #156 | Good 7.5% |
| Peruvians | 72.3 /100 | #157 | Good 7.5% |
| Croatians | 71.9 /100 | #158 | Good 7.5% |
| Immigrants | Philippines | 71.3 /100 | #159 | Good 7.5% |
| Bolivians | 70.8 /100 | #160 | Good 7.5% |
| Immigrants | Western Asia | 70.2 /100 | #161 | Good 7.5% |
| Immigrants | Lithuania | 68.8 /100 | #162 | Good 7.5% |
| British | 66.3 /100 | #163 | Good 7.6% |
| Ugandans | 65.8 /100 | #164 | Good 7.6% |
| Immigrants | South America | 65.6 /100 | #165 | Good 7.6% |
| Belgians | 63.5 /100 | #166 | Good 7.6% |