Immigrants from Japan vs Immigrants from Philippines 1st Grade
COMPARE
Immigrants from Japan
Immigrants from Philippines
1st Grade
1st Grade Comparison
Immigrants from Japan
Immigrants from Philippines
98.1%
1ST GRADE
93.7/ 100
METRIC RATING
125th/ 347
METRIC RANK
97.4%
1ST GRADE
0.1/ 100
METRIC RATING
276th/ 347
METRIC RANK
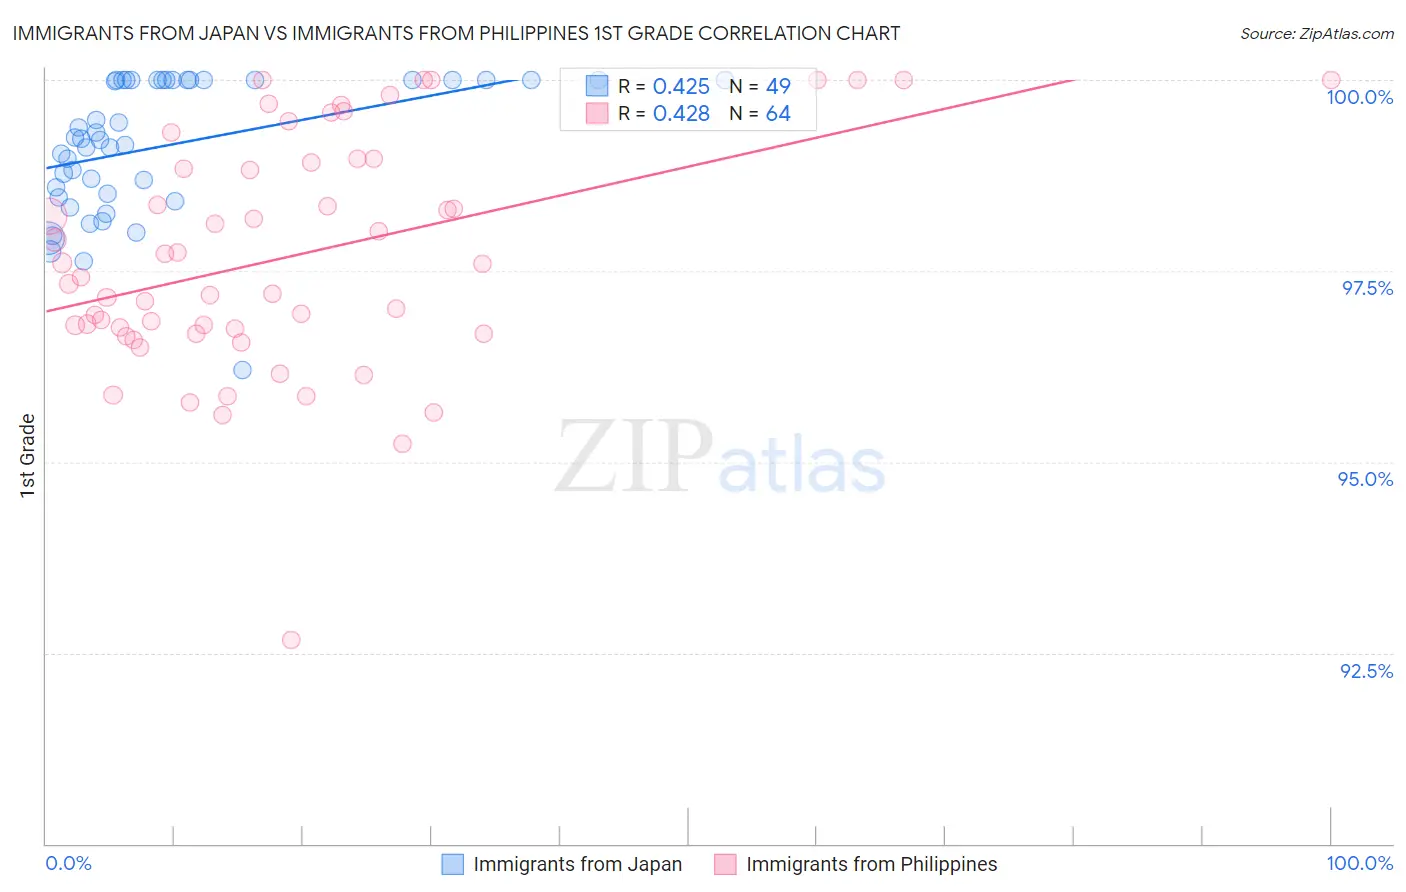
Immigrants from Japan vs Immigrants from Philippines 1st Grade Correlation Chart
The statistical analysis conducted on geographies consisting of 340,149,128 people shows a moderate positive correlation between the proportion of Immigrants from Japan and percentage of population with at least 1st grade education in the United States with a correlation coefficient (R) of 0.425 and weighted average of 98.1%. Similarly, the statistical analysis conducted on geographies consisting of 471,303,140 people shows a moderate positive correlation between the proportion of Immigrants from Philippines and percentage of population with at least 1st grade education in the United States with a correlation coefficient (R) of 0.428 and weighted average of 97.4%, a difference of 0.76%.
1st Grade Correlation Summary
| Measurement | Immigrants from Japan | Immigrants from Philippines |
| Minimum | 96.2% | 92.7% |
| Maximum | 100.0% | 100.0% |
| Range | 3.8% | 7.3% |
| Mean | 99.1% | 97.7% |
| Median | 99.2% | 97.5% |
| Interquartile 25% (IQ1) | 98.5% | 96.7% |
| Interquartile 75% (IQ3) | 100.0% | 98.9% |
| Interquartile Range (IQR) | 1.5% | 2.2% |
| Standard Deviation (Sample) | 0.88% | 1.5% |
| Standard Deviation (Population) | 0.87% | 1.5% |
Similar Demographics by 1st Grade
Demographics Similar to Immigrants from Japan by 1st Grade
In terms of 1st grade, the demographic groups most similar to Immigrants from Japan are Immigrants from Zimbabwe (98.1%, a difference of 0.0%), Menominee (98.1%, a difference of 0.0%), Iroquois (98.1%, a difference of 0.0%), Syrian (98.1%, a difference of 0.0%), and Lebanese (98.1%, a difference of 0.0%).
| Demographics | Rating | Rank | 1st Grade |
| Immigrants | France | 95.5 /100 | #118 | Exceptional 98.2% |
| Thais | 94.7 /100 | #119 | Exceptional 98.1% |
| Okinawans | 94.5 /100 | #120 | Exceptional 98.1% |
| Immigrants | Zimbabwe | 94.0 /100 | #121 | Exceptional 98.1% |
| Menominee | 93.9 /100 | #122 | Exceptional 98.1% |
| Iroquois | 93.8 /100 | #123 | Exceptional 98.1% |
| Syrians | 93.7 /100 | #124 | Exceptional 98.1% |
| Immigrants | Japan | 93.7 /100 | #125 | Exceptional 98.1% |
| Lebanese | 93.5 /100 | #126 | Exceptional 98.1% |
| Immigrants | Saudi Arabia | 93.3 /100 | #127 | Exceptional 98.1% |
| Immigrants | Serbia | 92.2 /100 | #128 | Exceptional 98.1% |
| Seminole | 91.9 /100 | #129 | Exceptional 98.1% |
| Immigrants | Croatia | 91.4 /100 | #130 | Exceptional 98.1% |
| Spaniards | 91.2 /100 | #131 | Exceptional 98.1% |
| Cambodians | 90.9 /100 | #132 | Exceptional 98.1% |
Demographics Similar to Immigrants from Philippines by 1st Grade
In terms of 1st grade, the demographic groups most similar to Immigrants from Philippines are Immigrants from Western Africa (97.4%, a difference of 0.010%), Ghanaian (97.4%, a difference of 0.020%), Immigrants from China (97.4%, a difference of 0.020%), Immigrants from Uzbekistan (97.4%, a difference of 0.030%), and Immigrants from Ghana (97.4%, a difference of 0.030%).
| Demographics | Rating | Rank | 1st Grade |
| West Indians | 0.3 /100 | #269 | Tragic 97.5% |
| Immigrants | Jamaica | 0.2 /100 | #270 | Tragic 97.5% |
| Immigrants | Cameroon | 0.2 /100 | #271 | Tragic 97.4% |
| Immigrants | Peru | 0.2 /100 | #272 | Tragic 97.4% |
| Immigrants | Bolivia | 0.2 /100 | #273 | Tragic 97.4% |
| Ghanaians | 0.1 /100 | #274 | Tragic 97.4% |
| Immigrants | China | 0.1 /100 | #275 | Tragic 97.4% |
| Immigrants | Philippines | 0.1 /100 | #276 | Tragic 97.4% |
| Immigrants | Western Africa | 0.1 /100 | #277 | Tragic 97.4% |
| Immigrants | Uzbekistan | 0.1 /100 | #278 | Tragic 97.4% |
| Immigrants | Ghana | 0.1 /100 | #279 | Tragic 97.4% |
| Afghans | 0.1 /100 | #280 | Tragic 97.4% |
| Trinidadians and Tobagonians | 0.1 /100 | #281 | Tragic 97.3% |
| Barbadians | 0.1 /100 | #282 | Tragic 97.3% |
| Immigrants | West Indies | 0.0 /100 | #283 | Tragic 97.3% |