Immigrants from Japan vs Immigrants from Latin America Unemployment Among Seniors over 65 years
COMPARE
Immigrants from Japan
Immigrants from Latin America
Unemployment Among Seniors over 65 years
Unemployment Among Seniors over 65 years Comparison
Immigrants from Japan
Immigrants from Latin America
4.9%
UNEMPLOYMENT AMONG SENIORS OVER 65 YEARS
99.2/ 100
METRIC RATING
73rd/ 347
METRIC RANK
5.6%
UNEMPLOYMENT AMONG SENIORS OVER 65 YEARS
0.0/ 100
METRIC RATING
303rd/ 347
METRIC RANK
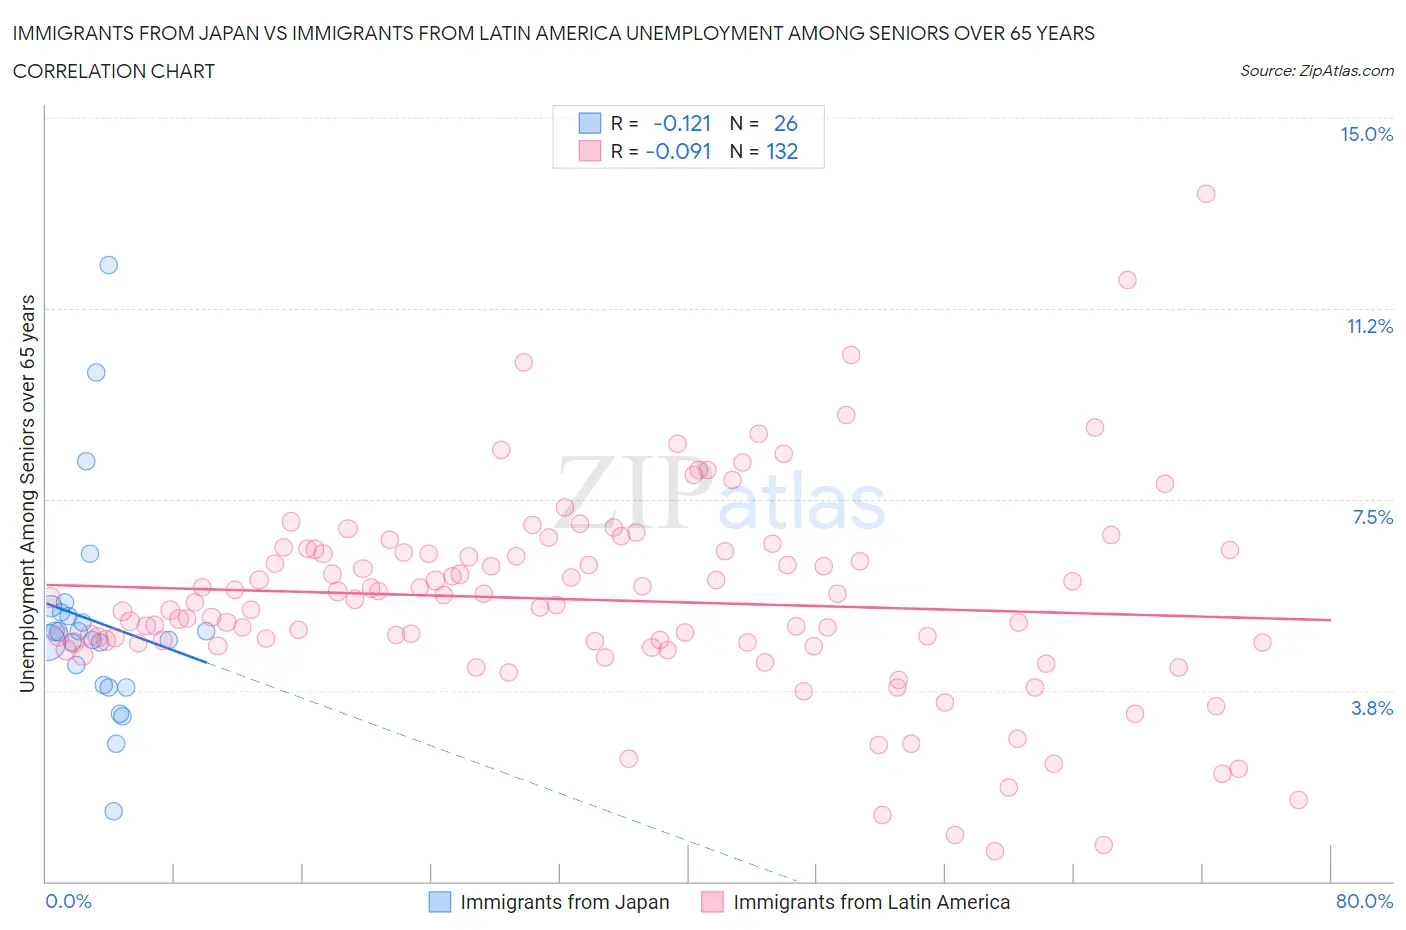
Immigrants from Japan vs Immigrants from Latin America Unemployment Among Seniors over 65 years Correlation Chart
The statistical analysis conducted on geographies consisting of 312,855,333 people shows a poor negative correlation between the proportion of Immigrants from Japan and unemployment rate amomg seniors over the age of 65 in the United States with a correlation coefficient (R) of -0.121 and weighted average of 4.9%. Similarly, the statistical analysis conducted on geographies consisting of 459,196,577 people shows a slight negative correlation between the proportion of Immigrants from Latin America and unemployment rate amomg seniors over the age of 65 in the United States with a correlation coefficient (R) of -0.091 and weighted average of 5.6%, a difference of 13.0%.
Unemployment Among Seniors over 65 years Correlation Summary
| Measurement | Immigrants from Japan | Immigrants from Latin America |
| Minimum | 1.4% | 0.60% |
| Maximum | 12.1% | 13.5% |
| Range | 10.7% | 12.9% |
| Mean | 5.1% | 5.5% |
| Median | 4.8% | 5.5% |
| Interquartile 25% (IQ1) | 3.9% | 4.7% |
| Interquartile 75% (IQ3) | 5.3% | 6.5% |
| Interquartile Range (IQR) | 1.4% | 1.8% |
| Standard Deviation (Sample) | 2.2% | 2.0% |
| Standard Deviation (Population) | 2.1% | 2.0% |
Similar Demographics by Unemployment Among Seniors over 65 years
Demographics Similar to Immigrants from Japan by Unemployment Among Seniors over 65 years
In terms of unemployment among seniors over 65 years, the demographic groups most similar to Immigrants from Japan are Japanese (4.9%, a difference of 0.030%), Nicaraguan (4.9%, a difference of 0.080%), British (4.9%, a difference of 0.11%), Welsh (5.0%, a difference of 0.15%), and Thai (5.0%, a difference of 0.16%).
| Demographics | Rating | Rank | Unemployment Among Seniors over 65 years |
| English | 99.5 /100 | #66 | Exceptional 4.9% |
| Iroquois | 99.5 /100 | #67 | Exceptional 4.9% |
| Bolivians | 99.5 /100 | #68 | Exceptional 4.9% |
| Scottish | 99.5 /100 | #69 | Exceptional 4.9% |
| Immigrants | Kazakhstan | 99.4 /100 | #70 | Exceptional 4.9% |
| Immigrants | Moldova | 99.4 /100 | #71 | Exceptional 4.9% |
| Nicaraguans | 99.3 /100 | #72 | Exceptional 4.9% |
| Immigrants | Japan | 99.2 /100 | #73 | Exceptional 4.9% |
| Japanese | 99.2 /100 | #74 | Exceptional 4.9% |
| British | 99.1 /100 | #75 | Exceptional 4.9% |
| Welsh | 99.1 /100 | #76 | Exceptional 5.0% |
| Thais | 99.1 /100 | #77 | Exceptional 5.0% |
| Slavs | 98.9 /100 | #78 | Exceptional 5.0% |
| Immigrants | Netherlands | 98.8 /100 | #79 | Exceptional 5.0% |
| Immigrants | Ethiopia | 98.6 /100 | #80 | Exceptional 5.0% |
Demographics Similar to Immigrants from Latin America by Unemployment Among Seniors over 65 years
In terms of unemployment among seniors over 65 years, the demographic groups most similar to Immigrants from Latin America are Liberian (5.6%, a difference of 0.070%), Guatemalan (5.6%, a difference of 0.090%), Mexican (5.6%, a difference of 0.24%), Hispanic or Latino (5.6%, a difference of 0.26%), and Ecuadorian (5.6%, a difference of 0.28%).
| Demographics | Rating | Rank | Unemployment Among Seniors over 65 years |
| Cape Verdeans | 0.0 /100 | #296 | Tragic 5.5% |
| Yaqui | 0.0 /100 | #297 | Tragic 5.5% |
| Immigrants | West Indies | 0.0 /100 | #298 | Tragic 5.6% |
| Guyanese | 0.0 /100 | #299 | Tragic 5.6% |
| Zimbabweans | 0.0 /100 | #300 | Tragic 5.6% |
| Hispanics or Latinos | 0.0 /100 | #301 | Tragic 5.6% |
| Guatemalans | 0.0 /100 | #302 | Tragic 5.6% |
| Immigrants | Latin America | 0.0 /100 | #303 | Tragic 5.6% |
| Liberians | 0.0 /100 | #304 | Tragic 5.6% |
| Mexicans | 0.0 /100 | #305 | Tragic 5.6% |
| Ecuadorians | 0.0 /100 | #306 | Tragic 5.6% |
| Portuguese | 0.0 /100 | #307 | Tragic 5.6% |
| Immigrants | St. Vincent and the Grenadines | 0.0 /100 | #308 | Tragic 5.6% |
| Immigrants | Guatemala | 0.0 /100 | #309 | Tragic 5.6% |
| Salvadorans | 0.0 /100 | #310 | Tragic 5.6% |