Immigrants from Sri Lanka vs Immigrants from Latin America Unemployment Among Seniors over 65 years
COMPARE
Immigrants from Sri Lanka
Immigrants from Latin America
Unemployment Among Seniors over 65 years
Unemployment Among Seniors over 65 years Comparison
Immigrants from Sri Lanka
Immigrants from Latin America
5.1%
UNEMPLOYMENT AMONG SENIORS OVER 65 YEARS
87.4/ 100
METRIC RATING
126th/ 347
METRIC RANK
5.6%
UNEMPLOYMENT AMONG SENIORS OVER 65 YEARS
0.0/ 100
METRIC RATING
303rd/ 347
METRIC RANK
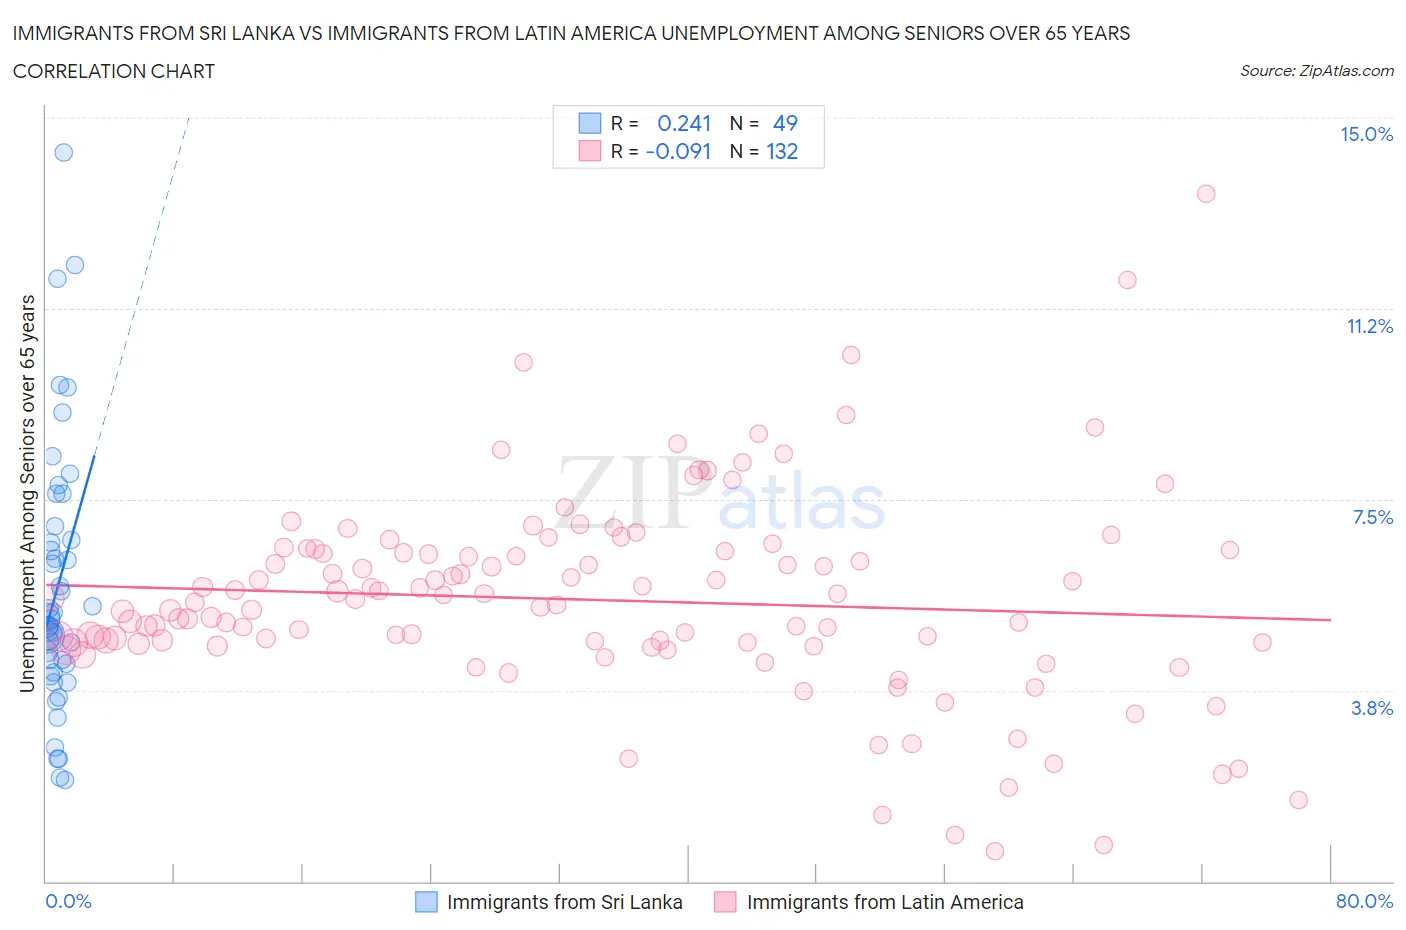
Immigrants from Sri Lanka vs Immigrants from Latin America Unemployment Among Seniors over 65 years Correlation Chart
The statistical analysis conducted on geographies consisting of 144,085,528 people shows a weak positive correlation between the proportion of Immigrants from Sri Lanka and unemployment rate amomg seniors over the age of 65 in the United States with a correlation coefficient (R) of 0.241 and weighted average of 5.1%. Similarly, the statistical analysis conducted on geographies consisting of 459,196,577 people shows a slight negative correlation between the proportion of Immigrants from Latin America and unemployment rate amomg seniors over the age of 65 in the United States with a correlation coefficient (R) of -0.091 and weighted average of 5.6%, a difference of 10.2%.
Unemployment Among Seniors over 65 years Correlation Summary
| Measurement | Immigrants from Sri Lanka | Immigrants from Latin America |
| Minimum | 2.0% | 0.60% |
| Maximum | 14.3% | 13.5% |
| Range | 12.3% | 12.9% |
| Mean | 5.8% | 5.5% |
| Median | 5.1% | 5.5% |
| Interquartile 25% (IQ1) | 4.2% | 4.7% |
| Interquartile 75% (IQ3) | 6.8% | 6.5% |
| Interquartile Range (IQR) | 2.6% | 1.8% |
| Standard Deviation (Sample) | 2.6% | 2.0% |
| Standard Deviation (Population) | 2.6% | 2.0% |
Similar Demographics by Unemployment Among Seniors over 65 years
Demographics Similar to Immigrants from Sri Lanka by Unemployment Among Seniors over 65 years
In terms of unemployment among seniors over 65 years, the demographic groups most similar to Immigrants from Sri Lanka are Sri Lankan (5.1%, a difference of 0.0%), Dutch (5.1%, a difference of 0.020%), Australian (5.1%, a difference of 0.020%), Immigrants from North America (5.1%, a difference of 0.040%), and Immigrants from England (5.1%, a difference of 0.050%).
| Demographics | Rating | Rank | Unemployment Among Seniors over 65 years |
| Immigrants | Canada | 89.7 /100 | #119 | Excellent 5.1% |
| Irish | 88.8 /100 | #120 | Excellent 5.1% |
| Puget Sound Salish | 88.7 /100 | #121 | Excellent 5.1% |
| Immigrants | Cameroon | 88.6 /100 | #122 | Excellent 5.1% |
| Asians | 88.5 /100 | #123 | Excellent 5.1% |
| Immigrants | North America | 87.9 /100 | #124 | Excellent 5.1% |
| Dutch | 87.6 /100 | #125 | Excellent 5.1% |
| Immigrants | Sri Lanka | 87.4 /100 | #126 | Excellent 5.1% |
| Sri Lankans | 87.4 /100 | #127 | Excellent 5.1% |
| Australians | 87.1 /100 | #128 | Excellent 5.1% |
| Immigrants | England | 86.7 /100 | #129 | Excellent 5.1% |
| Iranians | 86.6 /100 | #130 | Excellent 5.1% |
| Immigrants | Australia | 85.8 /100 | #131 | Excellent 5.1% |
| Chileans | 85.6 /100 | #132 | Excellent 5.1% |
| Syrians | 85.3 /100 | #133 | Excellent 5.1% |
Demographics Similar to Immigrants from Latin America by Unemployment Among Seniors over 65 years
In terms of unemployment among seniors over 65 years, the demographic groups most similar to Immigrants from Latin America are Liberian (5.6%, a difference of 0.070%), Guatemalan (5.6%, a difference of 0.090%), Mexican (5.6%, a difference of 0.24%), Hispanic or Latino (5.6%, a difference of 0.26%), and Ecuadorian (5.6%, a difference of 0.28%).
| Demographics | Rating | Rank | Unemployment Among Seniors over 65 years |
| Cape Verdeans | 0.0 /100 | #296 | Tragic 5.5% |
| Yaqui | 0.0 /100 | #297 | Tragic 5.5% |
| Immigrants | West Indies | 0.0 /100 | #298 | Tragic 5.6% |
| Guyanese | 0.0 /100 | #299 | Tragic 5.6% |
| Zimbabweans | 0.0 /100 | #300 | Tragic 5.6% |
| Hispanics or Latinos | 0.0 /100 | #301 | Tragic 5.6% |
| Guatemalans | 0.0 /100 | #302 | Tragic 5.6% |
| Immigrants | Latin America | 0.0 /100 | #303 | Tragic 5.6% |
| Liberians | 0.0 /100 | #304 | Tragic 5.6% |
| Mexicans | 0.0 /100 | #305 | Tragic 5.6% |
| Ecuadorians | 0.0 /100 | #306 | Tragic 5.6% |
| Portuguese | 0.0 /100 | #307 | Tragic 5.6% |
| Immigrants | St. Vincent and the Grenadines | 0.0 /100 | #308 | Tragic 5.6% |
| Immigrants | Guatemala | 0.0 /100 | #309 | Tragic 5.6% |
| Salvadorans | 0.0 /100 | #310 | Tragic 5.6% |