Immigrants from Japan vs Immigrants from Latin America Householder Income Under 25 years
COMPARE
Immigrants from Japan
Immigrants from Latin America
Householder Income Under 25 years
Householder Income Under 25 years Comparison
Immigrants from Japan
Immigrants from Latin America
$55,932
HOUSEHOLDER INCOME UNDER 25 YEARS
100.0/ 100
METRIC RATING
34th/ 347
METRIC RANK
$51,387
HOUSEHOLDER INCOME UNDER 25 YEARS
12.3/ 100
METRIC RATING
206th/ 347
METRIC RANK
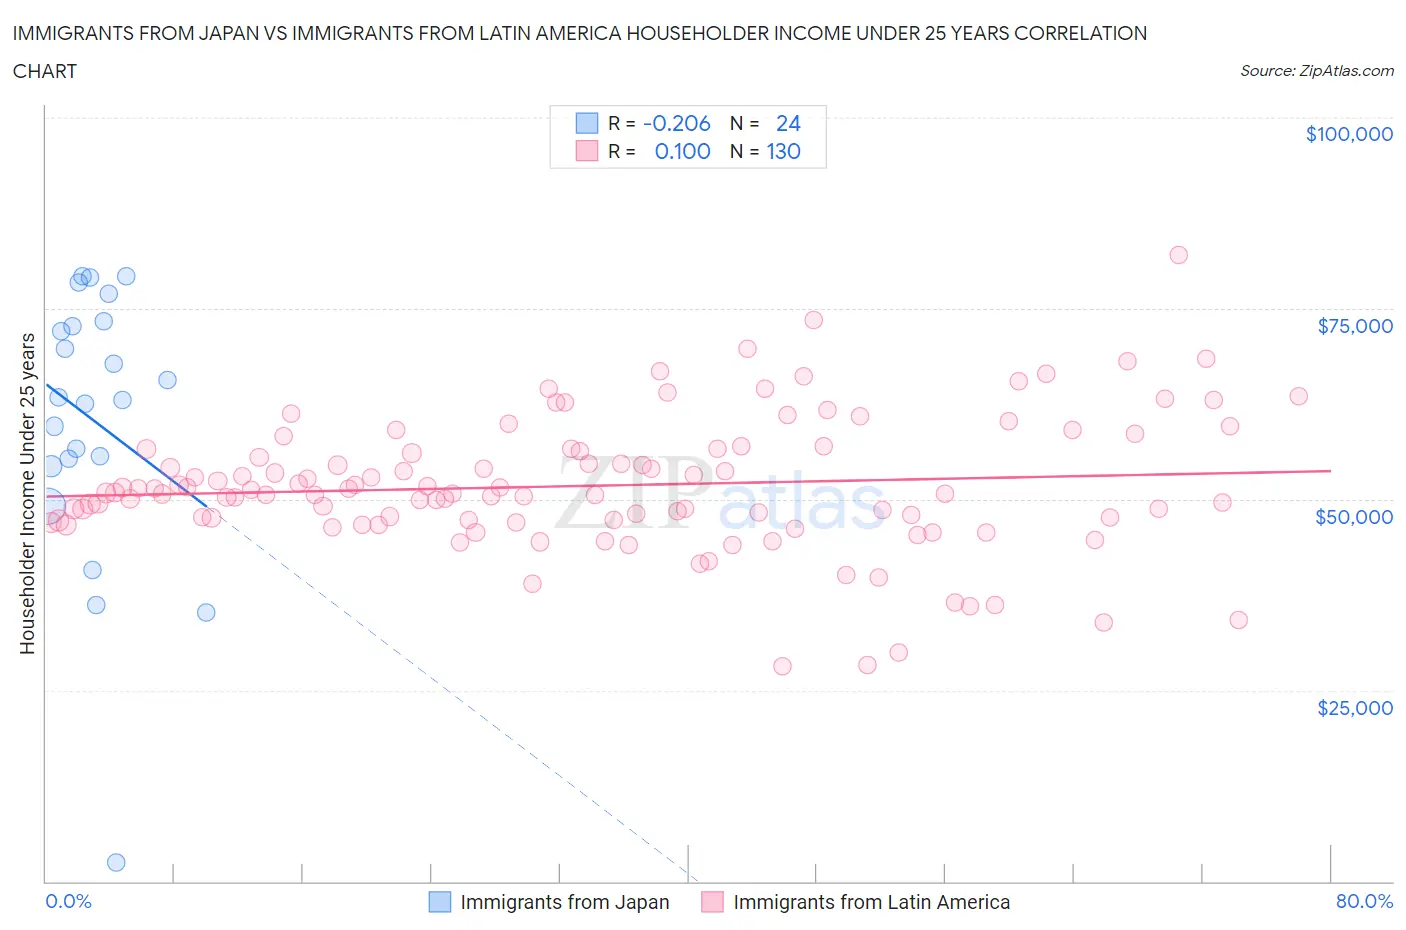
Immigrants from Japan vs Immigrants from Latin America Householder Income Under 25 years Correlation Chart
The statistical analysis conducted on geographies consisting of 293,469,097 people shows a weak negative correlation between the proportion of Immigrants from Japan and household income with householder under the age of 25 in the United States with a correlation coefficient (R) of -0.206 and weighted average of $55,932. Similarly, the statistical analysis conducted on geographies consisting of 435,231,480 people shows a poor positive correlation between the proportion of Immigrants from Latin America and household income with householder under the age of 25 in the United States with a correlation coefficient (R) of 0.100 and weighted average of $51,387, a difference of 8.8%.
Householder Income Under 25 years Correlation Summary
| Measurement | Immigrants from Japan | Immigrants from Latin America |
| Minimum | $2,499 | $28,148 |
| Maximum | $79,188 | $82,039 |
| Range | $76,689 | $53,891 |
| Mean | $60,335 | $51,773 |
| Median | $63,191 | $50,826 |
| Interquartile 25% (IQ1) | $54,827 | $47,269 |
| Interquartile 75% (IQ3) | $72,990 | $56,553 |
| Interquartile Range (IQR) | $18,164 | $9,284 |
| Standard Deviation (Sample) | $18,036 | $8,698 |
| Standard Deviation (Population) | $17,656 | $8,665 |
Similar Demographics by Householder Income Under 25 years
Demographics Similar to Immigrants from Japan by Householder Income Under 25 years
In terms of householder income under 25 years, the demographic groups most similar to Immigrants from Japan are Inupiat ($55,935, a difference of 0.010%), Tlingit-Haida ($55,914, a difference of 0.030%), Immigrants from Israel ($55,913, a difference of 0.030%), Immigrants from Russia ($55,891, a difference of 0.070%), and Immigrants from Iran ($55,880, a difference of 0.090%).
| Demographics | Rating | Rank | Householder Income Under 25 years |
| Immigrants | North Macedonia | 100.0 /100 | #27 | Exceptional $56,503 |
| Immigrants | Peru | 100.0 /100 | #28 | Exceptional $56,384 |
| Immigrants | Asia | 100.0 /100 | #29 | Exceptional $56,379 |
| Immigrants | Moldova | 100.0 /100 | #30 | Exceptional $56,168 |
| Vietnamese | 100.0 /100 | #31 | Exceptional $56,127 |
| Peruvians | 100.0 /100 | #32 | Exceptional $56,052 |
| Inupiat | 100.0 /100 | #33 | Exceptional $55,935 |
| Immigrants | Japan | 100.0 /100 | #34 | Exceptional $55,932 |
| Tlingit-Haida | 100.0 /100 | #35 | Exceptional $55,914 |
| Immigrants | Israel | 100.0 /100 | #36 | Exceptional $55,913 |
| Immigrants | Russia | 100.0 /100 | #37 | Exceptional $55,891 |
| Immigrants | Iran | 100.0 /100 | #38 | Exceptional $55,880 |
| Immigrants | Belarus | 100.0 /100 | #39 | Exceptional $55,743 |
| Immigrants | Greece | 100.0 /100 | #40 | Exceptional $55,727 |
| Immigrants | Guyana | 100.0 /100 | #41 | Exceptional $55,726 |
Demographics Similar to Immigrants from Latin America by Householder Income Under 25 years
In terms of householder income under 25 years, the demographic groups most similar to Immigrants from Latin America are Cape Verdean ($51,387, a difference of 0.0%), South African ($51,383, a difference of 0.010%), Immigrants from Jordan ($51,370, a difference of 0.030%), Czech ($51,421, a difference of 0.070%), and Syrian ($51,353, a difference of 0.070%).
| Demographics | Rating | Rank | Householder Income Under 25 years |
| Swiss | 15.4 /100 | #199 | Poor $51,493 |
| Immigrants | West Indies | 14.9 /100 | #200 | Poor $51,479 |
| British | 14.9 /100 | #201 | Poor $51,477 |
| Immigrants | Guatemala | 14.0 /100 | #202 | Poor $51,447 |
| Immigrants | Cameroon | 13.6 /100 | #203 | Poor $51,433 |
| Czechs | 13.2 /100 | #204 | Poor $51,421 |
| Cape Verdeans | 12.3 /100 | #205 | Poor $51,387 |
| Immigrants | Latin America | 12.3 /100 | #206 | Poor $51,387 |
| South Africans | 12.2 /100 | #207 | Poor $51,383 |
| Immigrants | Jordan | 11.9 /100 | #208 | Poor $51,370 |
| Syrians | 11.4 /100 | #209 | Poor $51,353 |
| Immigrants | Ghana | 10.9 /100 | #210 | Poor $51,333 |
| Irish | 10.6 /100 | #211 | Poor $51,317 |
| Immigrants | Panama | 9.7 /100 | #212 | Tragic $51,278 |
| Dutch | 9.4 /100 | #213 | Tragic $51,265 |