Immigrants from Japan vs Dutch West Indian Unemployment Among Seniors over 65 years
COMPARE
Immigrants from Japan
Dutch West Indian
Unemployment Among Seniors over 65 years
Unemployment Among Seniors over 65 years Comparison
Immigrants from Japan
Dutch West Indians
4.9%
UNEMPLOYMENT AMONG SENIORS OVER 65 YEARS
99.2/ 100
METRIC RATING
73rd/ 347
METRIC RANK
5.3%
UNEMPLOYMENT AMONG SENIORS OVER 65 YEARS
6.9/ 100
METRIC RATING
219th/ 347
METRIC RANK
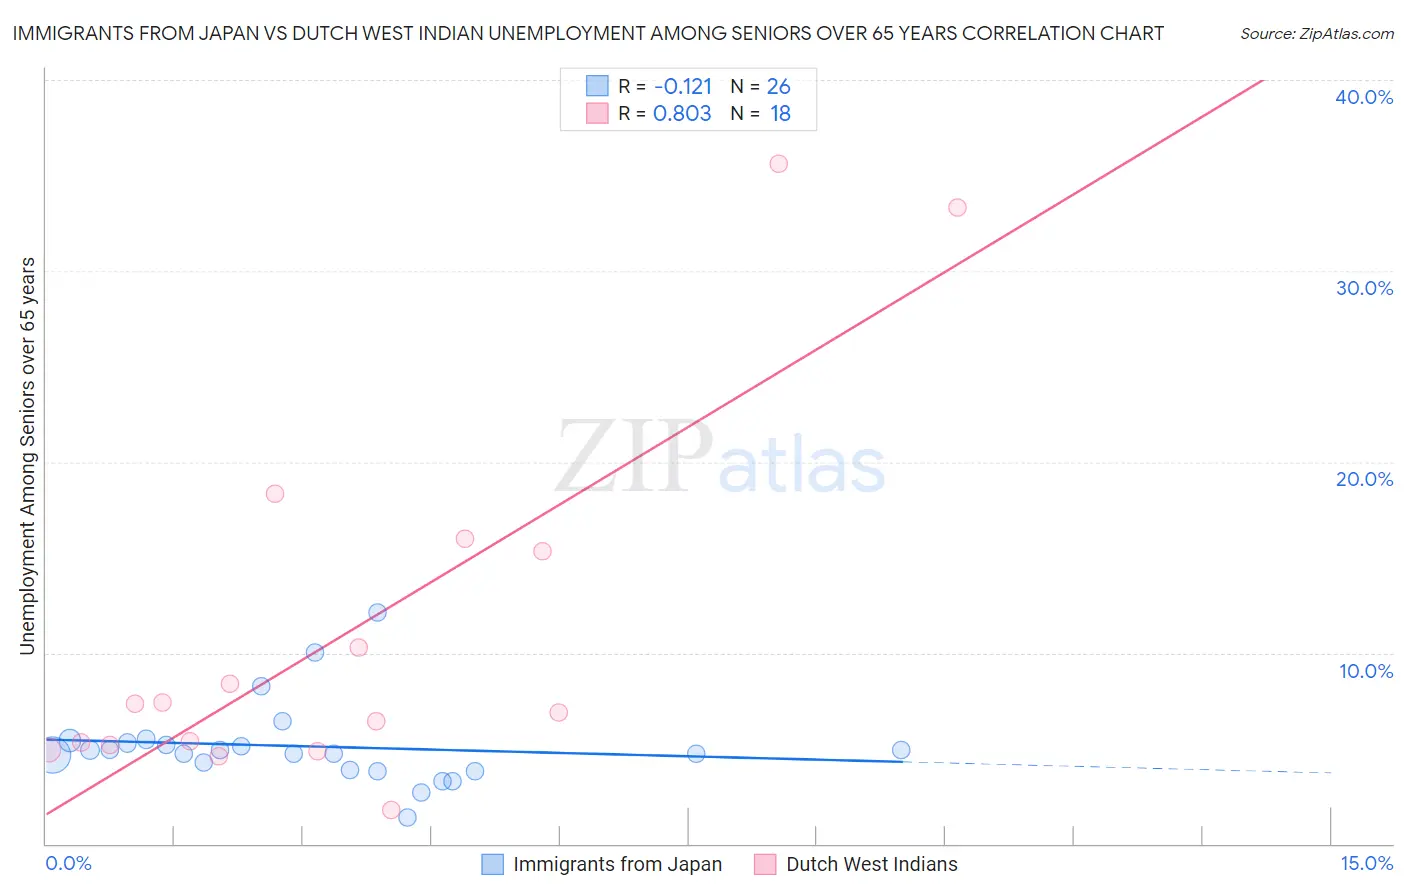
Immigrants from Japan vs Dutch West Indian Unemployment Among Seniors over 65 years Correlation Chart
The statistical analysis conducted on geographies consisting of 312,855,333 people shows a poor negative correlation between the proportion of Immigrants from Japan and unemployment rate amomg seniors over the age of 65 in the United States with a correlation coefficient (R) of -0.121 and weighted average of 4.9%. Similarly, the statistical analysis conducted on geographies consisting of 79,874,361 people shows a very strong positive correlation between the proportion of Dutch West Indians and unemployment rate amomg seniors over the age of 65 in the United States with a correlation coefficient (R) of 0.803 and weighted average of 5.3%, a difference of 6.2%.
Unemployment Among Seniors over 65 years Correlation Summary
| Measurement | Immigrants from Japan | Dutch West Indian |
| Minimum | 1.4% | 1.8% |
| Maximum | 12.1% | 35.6% |
| Range | 10.7% | 33.8% |
| Mean | 5.1% | 11.0% |
| Median | 4.8% | 7.1% |
| Interquartile 25% (IQ1) | 3.9% | 5.2% |
| Interquartile 75% (IQ3) | 5.3% | 15.3% |
| Interquartile Range (IQR) | 1.4% | 10.1% |
| Standard Deviation (Sample) | 2.2% | 9.6% |
| Standard Deviation (Population) | 2.1% | 9.3% |
Similar Demographics by Unemployment Among Seniors over 65 years
Demographics Similar to Immigrants from Japan by Unemployment Among Seniors over 65 years
In terms of unemployment among seniors over 65 years, the demographic groups most similar to Immigrants from Japan are Japanese (4.9%, a difference of 0.030%), Nicaraguan (4.9%, a difference of 0.080%), British (4.9%, a difference of 0.11%), Welsh (5.0%, a difference of 0.15%), and Thai (5.0%, a difference of 0.16%).
| Demographics | Rating | Rank | Unemployment Among Seniors over 65 years |
| English | 99.5 /100 | #66 | Exceptional 4.9% |
| Iroquois | 99.5 /100 | #67 | Exceptional 4.9% |
| Bolivians | 99.5 /100 | #68 | Exceptional 4.9% |
| Scottish | 99.5 /100 | #69 | Exceptional 4.9% |
| Immigrants | Kazakhstan | 99.4 /100 | #70 | Exceptional 4.9% |
| Immigrants | Moldova | 99.4 /100 | #71 | Exceptional 4.9% |
| Nicaraguans | 99.3 /100 | #72 | Exceptional 4.9% |
| Immigrants | Japan | 99.2 /100 | #73 | Exceptional 4.9% |
| Japanese | 99.2 /100 | #74 | Exceptional 4.9% |
| British | 99.1 /100 | #75 | Exceptional 4.9% |
| Welsh | 99.1 /100 | #76 | Exceptional 5.0% |
| Thais | 99.1 /100 | #77 | Exceptional 5.0% |
| Slavs | 98.9 /100 | #78 | Exceptional 5.0% |
| Immigrants | Netherlands | 98.8 /100 | #79 | Exceptional 5.0% |
| Immigrants | Ethiopia | 98.6 /100 | #80 | Exceptional 5.0% |
Demographics Similar to Dutch West Indians by Unemployment Among Seniors over 65 years
In terms of unemployment among seniors over 65 years, the demographic groups most similar to Dutch West Indians are Spaniard (5.2%, a difference of 0.060%), Egyptian (5.3%, a difference of 0.060%), Arapaho (5.3%, a difference of 0.070%), Israeli (5.3%, a difference of 0.080%), and Cree (5.3%, a difference of 0.15%).
| Demographics | Rating | Rank | Unemployment Among Seniors over 65 years |
| Immigrants | Honduras | 10.2 /100 | #212 | Poor 5.2% |
| Immigrants | Uruguay | 9.3 /100 | #213 | Tragic 5.2% |
| Albanians | 9.1 /100 | #214 | Tragic 5.2% |
| Immigrants | Fiji | 8.6 /100 | #215 | Tragic 5.2% |
| Cajuns | 8.5 /100 | #216 | Tragic 5.2% |
| Italians | 8.3 /100 | #217 | Tragic 5.2% |
| Spaniards | 7.4 /100 | #218 | Tragic 5.2% |
| Dutch West Indians | 6.9 /100 | #219 | Tragic 5.3% |
| Egyptians | 6.4 /100 | #220 | Tragic 5.3% |
| Arapaho | 6.3 /100 | #221 | Tragic 5.3% |
| Israelis | 6.2 /100 | #222 | Tragic 5.3% |
| Cree | 5.8 /100 | #223 | Tragic 5.3% |
| Immigrants | Syria | 5.6 /100 | #224 | Tragic 5.3% |
| Hondurans | 5.6 /100 | #225 | Tragic 5.3% |
| Immigrants | Croatia | 5.3 /100 | #226 | Tragic 5.3% |