Immigrants from Iraq vs Canadian Unemployment
COMPARE
Immigrants from Iraq
Canadian
Unemployment
Unemployment Comparison
Immigrants from Iraq
Canadians
5.4%
UNEMPLOYMENT
18.6/ 100
METRIC RATING
210th/ 347
METRIC RANK
5.0%
UNEMPLOYMENT
97.7/ 100
METRIC RATING
79th/ 347
METRIC RANK
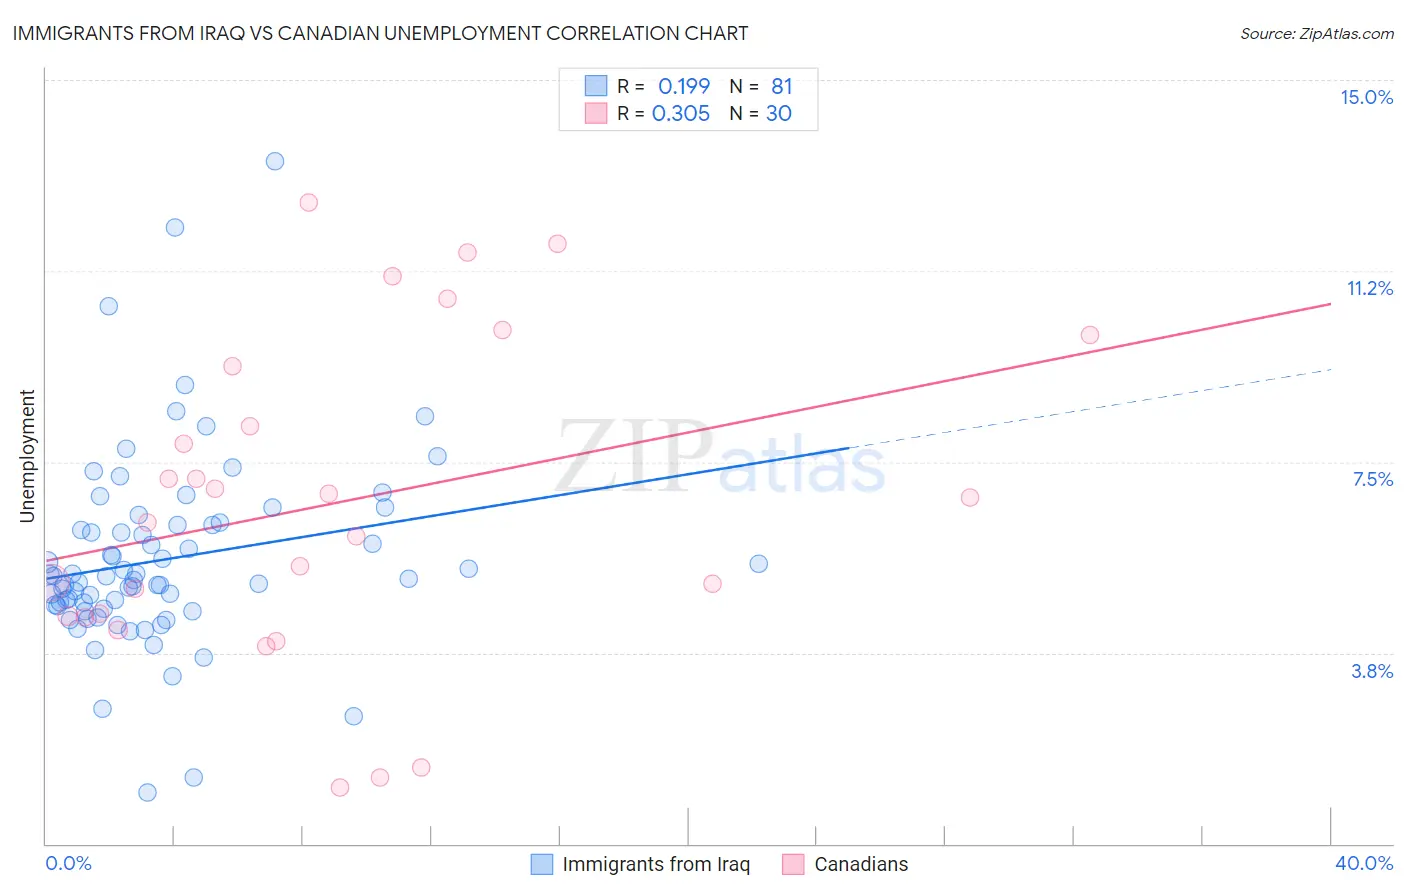
Immigrants from Iraq vs Canadian Unemployment Correlation Chart
The statistical analysis conducted on geographies consisting of 194,739,178 people shows a poor positive correlation between the proportion of Immigrants from Iraq and unemployment in the United States with a correlation coefficient (R) of 0.199 and weighted average of 5.4%. Similarly, the statistical analysis conducted on geographies consisting of 436,779,128 people shows a mild positive correlation between the proportion of Canadians and unemployment in the United States with a correlation coefficient (R) of 0.305 and weighted average of 5.0%, a difference of 8.5%.
Unemployment Correlation Summary
| Measurement | Immigrants from Iraq | Canadian |
| Minimum | 1.0% | 1.1% |
| Maximum | 13.4% | 12.6% |
| Range | 12.4% | 11.5% |
| Mean | 5.6% | 6.7% |
| Median | 5.2% | 6.6% |
| Interquartile 25% (IQ1) | 4.6% | 4.5% |
| Interquartile 75% (IQ3) | 6.3% | 9.4% |
| Interquartile Range (IQR) | 1.6% | 4.9% |
| Standard Deviation (Sample) | 1.9% | 3.2% |
| Standard Deviation (Population) | 1.9% | 3.1% |
Similar Demographics by Unemployment
Demographics Similar to Immigrants from Iraq by Unemployment
In terms of unemployment, the demographic groups most similar to Immigrants from Iraq are Immigrants from Iran (5.4%, a difference of 0.020%), Portuguese (5.4%, a difference of 0.050%), Iraqi (5.4%, a difference of 0.050%), Ugandan (5.4%, a difference of 0.060%), and Creek (5.4%, a difference of 0.080%).
| Demographics | Rating | Rank | Unemployment |
| Immigrants | Micronesia | 25.2 /100 | #203 | Fair 5.3% |
| Immigrants | Ukraine | 24.9 /100 | #204 | Fair 5.3% |
| Native Hawaiians | 24.1 /100 | #205 | Fair 5.3% |
| Immigrants | Peru | 22.7 /100 | #206 | Fair 5.4% |
| Creek | 19.4 /100 | #207 | Poor 5.4% |
| Portuguese | 19.0 /100 | #208 | Poor 5.4% |
| Immigrants | Iran | 18.8 /100 | #209 | Poor 5.4% |
| Immigrants | Iraq | 18.6 /100 | #210 | Poor 5.4% |
| Iraqis | 18.1 /100 | #211 | Poor 5.4% |
| Ugandans | 18.0 /100 | #212 | Poor 5.4% |
| Immigrants | Middle Africa | 15.3 /100 | #213 | Poor 5.4% |
| Immigrants | Costa Rica | 15.2 /100 | #214 | Poor 5.4% |
| Delaware | 14.7 /100 | #215 | Poor 5.4% |
| Immigrants | South America | 13.5 /100 | #216 | Poor 5.4% |
| Immigrants | Albania | 13.5 /100 | #217 | Poor 5.4% |
Demographics Similar to Canadians by Unemployment
In terms of unemployment, the demographic groups most similar to Canadians are Immigrants from Sweden (5.0%, a difference of 0.070%), Basque (5.0%, a difference of 0.080%), Fijian (5.0%, a difference of 0.090%), Hmong (5.0%, a difference of 0.10%), and Okinawan (4.9%, a difference of 0.12%).
| Demographics | Rating | Rank | Unemployment |
| Burmese | 98.3 /100 | #72 | Exceptional 4.9% |
| Paraguayans | 98.3 /100 | #73 | Exceptional 4.9% |
| Immigrants | Northern Europe | 98.2 /100 | #74 | Exceptional 4.9% |
| Turks | 98.0 /100 | #75 | Exceptional 4.9% |
| German Russians | 98.0 /100 | #76 | Exceptional 4.9% |
| Cypriots | 97.9 /100 | #77 | Exceptional 4.9% |
| Okinawans | 97.9 /100 | #78 | Exceptional 4.9% |
| Canadians | 97.7 /100 | #79 | Exceptional 5.0% |
| Immigrants | Sweden | 97.6 /100 | #80 | Exceptional 5.0% |
| Basques | 97.6 /100 | #81 | Exceptional 5.0% |
| Fijians | 97.6 /100 | #82 | Exceptional 5.0% |
| Hmong | 97.6 /100 | #83 | Exceptional 5.0% |
| Russians | 97.4 /100 | #84 | Exceptional 5.0% |
| Immigrants | Australia | 97.0 /100 | #85 | Exceptional 5.0% |
| Hungarians | 96.9 /100 | #86 | Exceptional 5.0% |