Immigrants from Iran vs Immigrants from Western Europe Unemployment
COMPARE
Immigrants from Iran
Immigrants from Western Europe
Unemployment
Unemployment Comparison
Immigrants from Iran
Immigrants from Western Europe
5.4%
UNEMPLOYMENT
18.8/ 100
METRIC RATING
209th/ 347
METRIC RANK
5.1%
UNEMPLOYMENT
91.1/ 100
METRIC RATING
115th/ 347
METRIC RANK
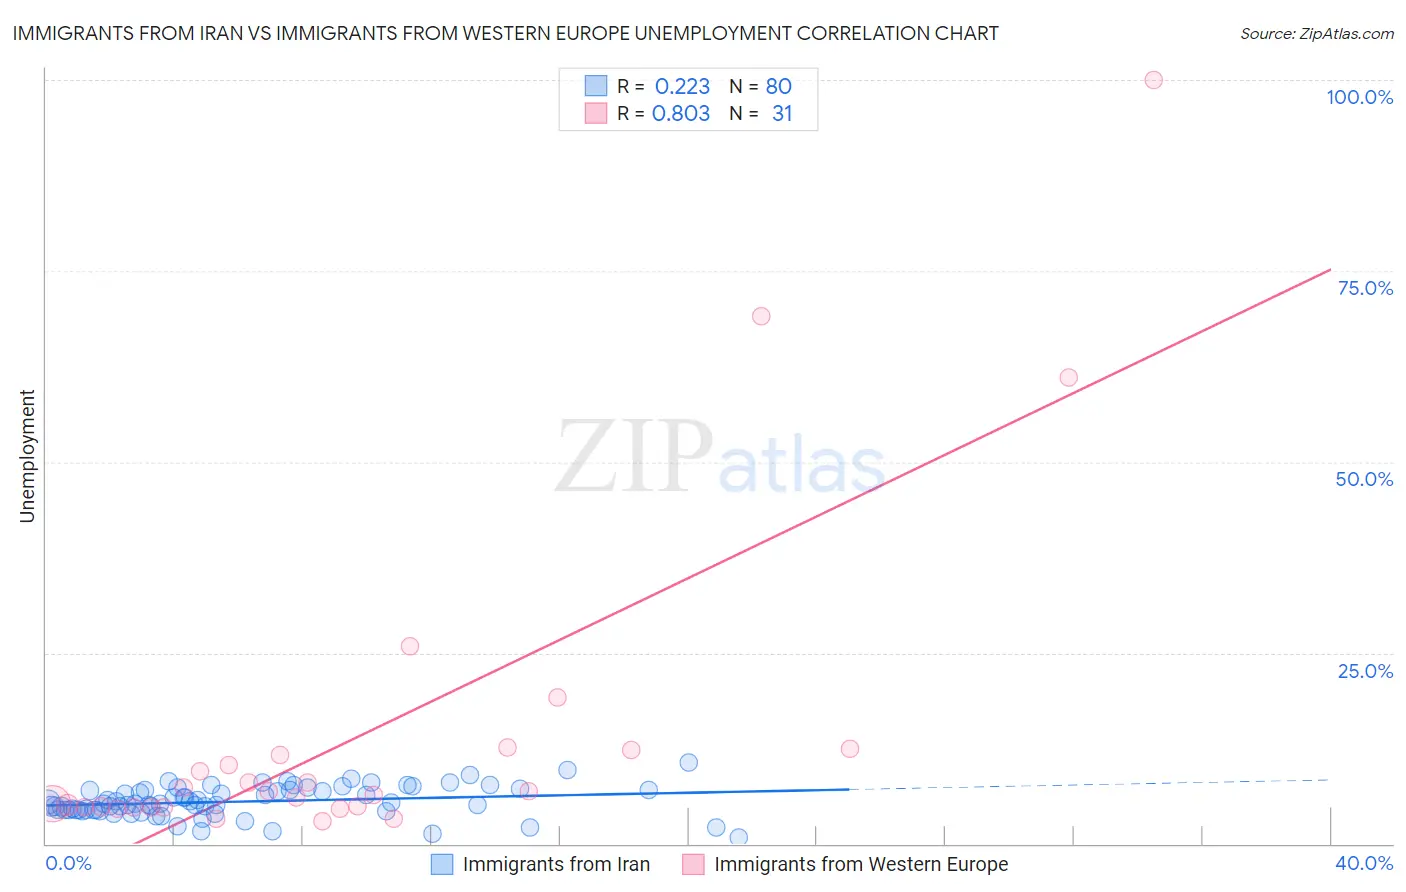
Immigrants from Iran vs Immigrants from Western Europe Unemployment Correlation Chart
The statistical analysis conducted on geographies consisting of 279,810,569 people shows a weak positive correlation between the proportion of Immigrants from Iran and unemployment in the United States with a correlation coefficient (R) of 0.223 and weighted average of 5.4%. Similarly, the statistical analysis conducted on geographies consisting of 492,944,202 people shows a very strong positive correlation between the proportion of Immigrants from Western Europe and unemployment in the United States with a correlation coefficient (R) of 0.803 and weighted average of 5.1%, a difference of 6.0%.
Unemployment Correlation Summary
| Measurement | Immigrants from Iran | Immigrants from Western Europe |
| Minimum | 0.80% | 2.9% |
| Maximum | 10.7% | 100.0% |
| Range | 9.9% | 97.1% |
| Mean | 5.5% | 14.5% |
| Median | 5.2% | 6.8% |
| Interquartile 25% (IQ1) | 4.4% | 4.8% |
| Interquartile 75% (IQ3) | 7.1% | 12.2% |
| Interquartile Range (IQR) | 2.6% | 7.4% |
| Standard Deviation (Sample) | 2.0% | 21.9% |
| Standard Deviation (Population) | 2.0% | 21.5% |
Similar Demographics by Unemployment
Demographics Similar to Immigrants from Iran by Unemployment
In terms of unemployment, the demographic groups most similar to Immigrants from Iran are Immigrants from Iraq (5.4%, a difference of 0.020%), Portuguese (5.4%, a difference of 0.030%), Creek (5.4%, a difference of 0.060%), Iraqi (5.4%, a difference of 0.070%), and Ugandan (5.4%, a difference of 0.080%).
| Demographics | Rating | Rank | Unemployment |
| Cherokee | 25.5 /100 | #202 | Fair 5.3% |
| Immigrants | Micronesia | 25.2 /100 | #203 | Fair 5.3% |
| Immigrants | Ukraine | 24.9 /100 | #204 | Fair 5.3% |
| Native Hawaiians | 24.1 /100 | #205 | Fair 5.3% |
| Immigrants | Peru | 22.7 /100 | #206 | Fair 5.4% |
| Creek | 19.4 /100 | #207 | Poor 5.4% |
| Portuguese | 19.0 /100 | #208 | Poor 5.4% |
| Immigrants | Iran | 18.8 /100 | #209 | Poor 5.4% |
| Immigrants | Iraq | 18.6 /100 | #210 | Poor 5.4% |
| Iraqis | 18.1 /100 | #211 | Poor 5.4% |
| Ugandans | 18.0 /100 | #212 | Poor 5.4% |
| Immigrants | Middle Africa | 15.3 /100 | #213 | Poor 5.4% |
| Immigrants | Costa Rica | 15.2 /100 | #214 | Poor 5.4% |
| Delaware | 14.7 /100 | #215 | Poor 5.4% |
| Immigrants | South America | 13.5 /100 | #216 | Poor 5.4% |
Demographics Similar to Immigrants from Western Europe by Unemployment
In terms of unemployment, the demographic groups most similar to Immigrants from Western Europe are Immigrants from Sri Lanka (5.1%, a difference of 0.010%), Immigrants from Malaysia (5.1%, a difference of 0.030%), Immigrants from Germany (5.1%, a difference of 0.070%), Immigrants from Ireland (5.1%, a difference of 0.21%), and Argentinean (5.1%, a difference of 0.27%).
| Demographics | Rating | Rank | Unemployment |
| Immigrants | Kuwait | 93.7 /100 | #108 | Exceptional 5.0% |
| Immigrants | Eritrea | 93.3 /100 | #109 | Exceptional 5.0% |
| Immigrants | Lithuania | 93.2 /100 | #110 | Exceptional 5.0% |
| Chileans | 93.2 /100 | #111 | Exceptional 5.0% |
| South Africans | 92.6 /100 | #112 | Exceptional 5.1% |
| Argentineans | 92.4 /100 | #113 | Exceptional 5.1% |
| Immigrants | Ireland | 92.1 /100 | #114 | Exceptional 5.1% |
| Immigrants | Western Europe | 91.1 /100 | #115 | Exceptional 5.1% |
| Immigrants | Sri Lanka | 91.1 /100 | #116 | Exceptional 5.1% |
| Immigrants | Malaysia | 91.0 /100 | #117 | Exceptional 5.1% |
| Immigrants | Germany | 90.8 /100 | #118 | Exceptional 5.1% |
| Immigrants | France | 89.7 /100 | #119 | Excellent 5.1% |
| Macedonians | 89.7 /100 | #120 | Excellent 5.1% |
| Lebanese | 89.2 /100 | #121 | Excellent 5.1% |
| Immigrants | Switzerland | 89.1 /100 | #122 | Excellent 5.1% |