Immigrants from Indonesia vs Kiowa Female Unemployment
COMPARE
Immigrants from Indonesia
Kiowa
Female Unemployment
Female Unemployment Comparison
Immigrants from Indonesia
Kiowa
5.3%
FEMALE UNEMPLOYMENT
40.7/ 100
METRIC RATING
183rd/ 347
METRIC RANK
5.8%
FEMALE UNEMPLOYMENT
0.1/ 100
METRIC RATING
261st/ 347
METRIC RANK
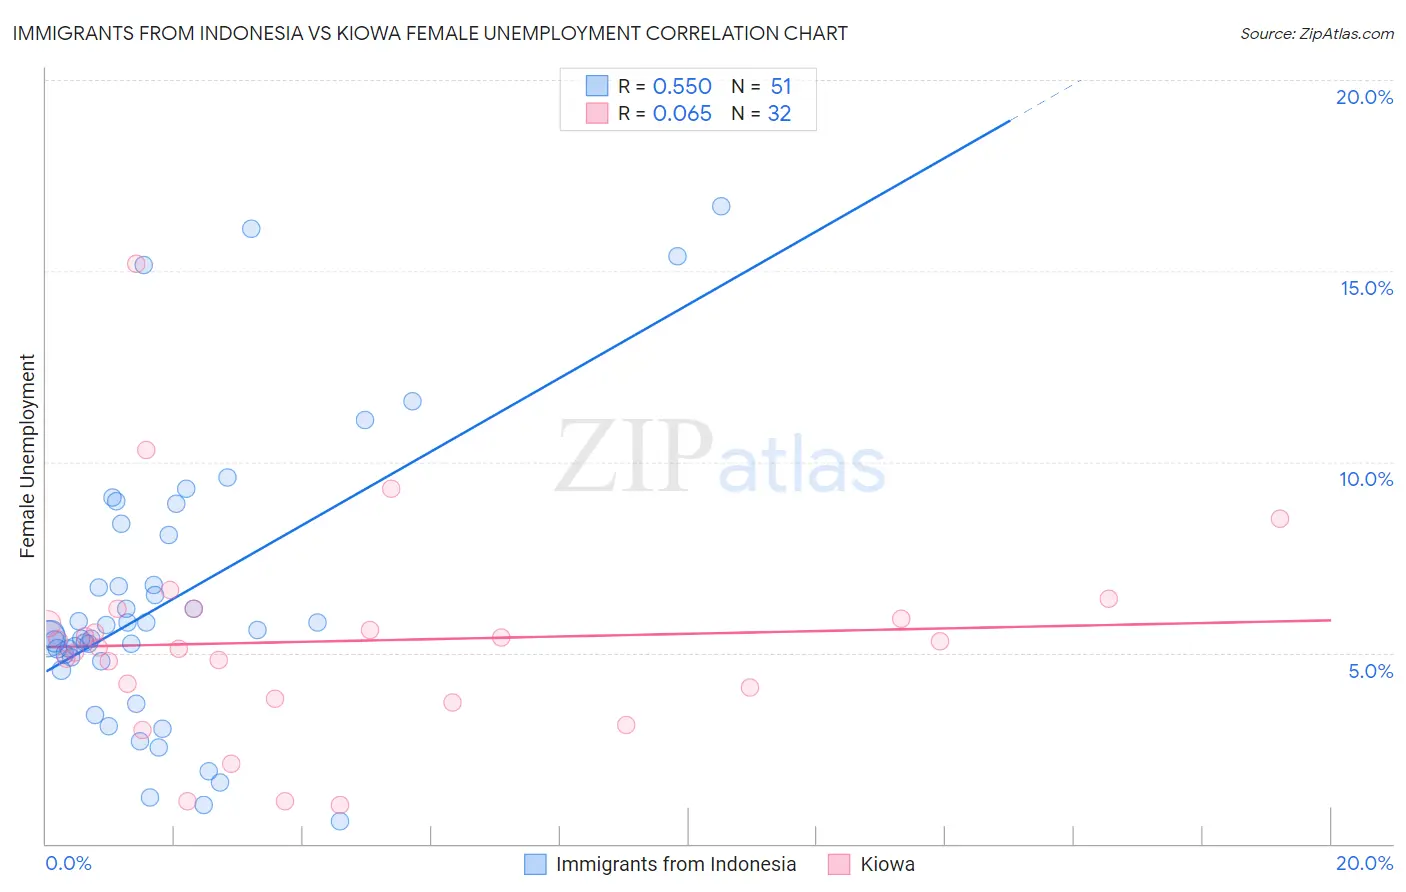
Immigrants from Indonesia vs Kiowa Female Unemployment Correlation Chart
The statistical analysis conducted on geographies consisting of 215,529,096 people shows a substantial positive correlation between the proportion of Immigrants from Indonesia and unemploymnet rate among females in the United States with a correlation coefficient (R) of 0.550 and weighted average of 5.3%. Similarly, the statistical analysis conducted on geographies consisting of 55,997,054 people shows a slight positive correlation between the proportion of Kiowa and unemploymnet rate among females in the United States with a correlation coefficient (R) of 0.065 and weighted average of 5.8%, a difference of 9.2%.
Female Unemployment Correlation Summary
| Measurement | Immigrants from Indonesia | Kiowa |
| Minimum | 0.60% | 1.0% |
| Maximum | 16.7% | 15.2% |
| Range | 16.1% | 14.2% |
| Mean | 6.3% | 5.3% |
| Median | 5.5% | 5.2% |
| Interquartile 25% (IQ1) | 4.8% | 4.0% |
| Interquartile 75% (IQ3) | 8.1% | 6.0% |
| Interquartile Range (IQR) | 3.3% | 2.1% |
| Standard Deviation (Sample) | 3.7% | 2.8% |
| Standard Deviation (Population) | 3.7% | 2.7% |
Similar Demographics by Female Unemployment
Demographics Similar to Immigrants from Indonesia by Female Unemployment
In terms of female unemployment, the demographic groups most similar to Immigrants from Indonesia are Immigrants from Ukraine (5.3%, a difference of 0.030%), Malaysian (5.3%, a difference of 0.040%), Immigrants from Belarus (5.3%, a difference of 0.080%), Taiwanese (5.3%, a difference of 0.12%), and Nonimmigrants (5.3%, a difference of 0.12%).
| Demographics | Rating | Rank | Female Unemployment |
| Immigrants | Vietnam | 47.5 /100 | #176 | Average 5.3% |
| Immigrants | Morocco | 47.4 /100 | #177 | Average 5.3% |
| Immigrants | Southern Europe | 46.2 /100 | #178 | Average 5.3% |
| Laotians | 45.1 /100 | #179 | Average 5.3% |
| Immigrants | Congo | 43.1 /100 | #180 | Average 5.3% |
| Taiwanese | 42.7 /100 | #181 | Average 5.3% |
| Immigrants | Nonimmigrants | 42.6 /100 | #182 | Average 5.3% |
| Immigrants | Indonesia | 40.7 /100 | #183 | Average 5.3% |
| Immigrants | Ukraine | 40.1 /100 | #184 | Average 5.3% |
| Malaysians | 40.1 /100 | #185 | Average 5.3% |
| Immigrants | Belarus | 39.4 /100 | #186 | Fair 5.3% |
| Immigrants | Albania | 35.4 /100 | #187 | Fair 5.3% |
| Afghans | 33.9 /100 | #188 | Fair 5.3% |
| Costa Ricans | 33.8 /100 | #189 | Fair 5.3% |
| Ugandans | 31.2 /100 | #190 | Fair 5.3% |
Demographics Similar to Kiowa by Female Unemployment
In terms of female unemployment, the demographic groups most similar to Kiowa are Immigrants from Nigeria (5.8%, a difference of 0.030%), Nigerian (5.8%, a difference of 0.26%), Immigrants from Fiji (5.8%, a difference of 0.30%), Immigrants from Portugal (5.8%, a difference of 0.41%), and Immigrants from the Azores (5.8%, a difference of 0.71%).
| Demographics | Rating | Rank | Female Unemployment |
| Immigrants | Immigrants | 0.6 /100 | #254 | Tragic 5.7% |
| Immigrants | Cameroon | 0.6 /100 | #255 | Tragic 5.7% |
| Sub-Saharan Africans | 0.4 /100 | #256 | Tragic 5.7% |
| Dutch West Indians | 0.3 /100 | #257 | Tragic 5.7% |
| Immigrants | Portugal | 0.2 /100 | #258 | Tragic 5.8% |
| Immigrants | Fiji | 0.2 /100 | #259 | Tragic 5.8% |
| Nigerians | 0.2 /100 | #260 | Tragic 5.8% |
| Kiowa | 0.1 /100 | #261 | Tragic 5.8% |
| Immigrants | Nigeria | 0.1 /100 | #262 | Tragic 5.8% |
| Immigrants | Azores | 0.1 /100 | #263 | Tragic 5.8% |
| Immigrants | Bahamas | 0.1 /100 | #264 | Tragic 5.8% |
| Blackfeet | 0.0 /100 | #265 | Tragic 5.9% |
| Cape Verdeans | 0.0 /100 | #266 | Tragic 5.9% |
| Nepalese | 0.0 /100 | #267 | Tragic 5.9% |
| Hondurans | 0.0 /100 | #268 | Tragic 5.9% |