Immigrants from India vs Barbadian Unemployment Among Women with Children Under 18 years
COMPARE
Immigrants from India
Barbadian
Unemployment Among Women with Children Under 18 years
Unemployment Among Women with Children Under 18 years Comparison
Immigrants from India
Barbadians
4.7%
UNEMPLOYMENT AMONG WOMEN WITH CHILDREN UNDER 18 YEARS
100.0/ 100
METRIC RATING
7th/ 347
METRIC RANK
6.4%
UNEMPLOYMENT AMONG WOMEN WITH CHILDREN UNDER 18 YEARS
0.0/ 100
METRIC RATING
295th/ 347
METRIC RANK
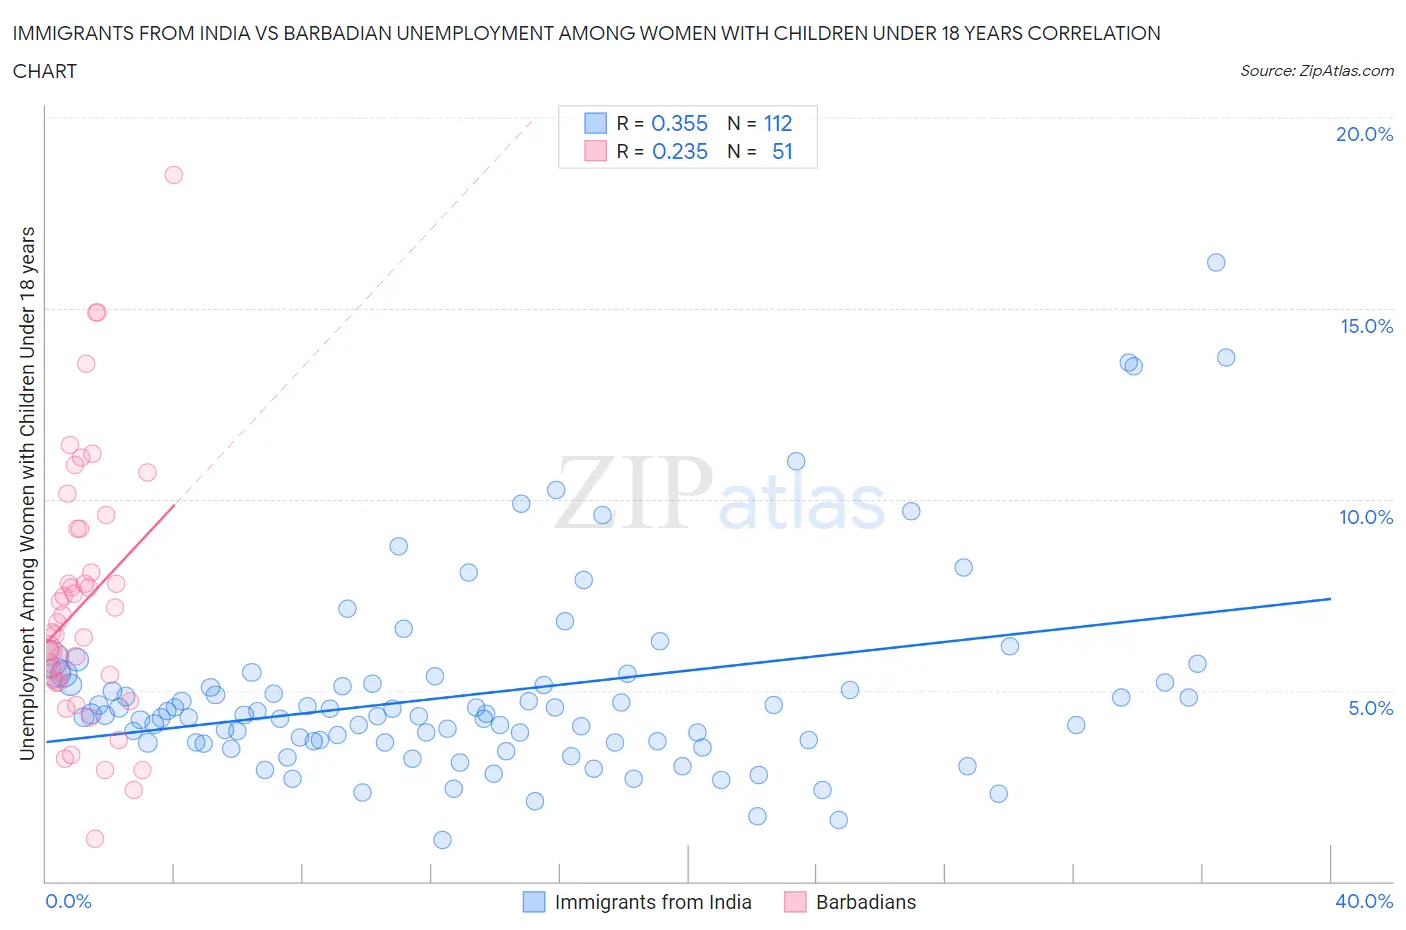
Immigrants from India vs Barbadian Unemployment Among Women with Children Under 18 years Correlation Chart
The statistical analysis conducted on geographies consisting of 416,043,448 people shows a mild positive correlation between the proportion of Immigrants from India and unemployment rate among women with children under the age of 18 in the United States with a correlation coefficient (R) of 0.355 and weighted average of 4.7%. Similarly, the statistical analysis conducted on geographies consisting of 139,822,827 people shows a weak positive correlation between the proportion of Barbadians and unemployment rate among women with children under the age of 18 in the United States with a correlation coefficient (R) of 0.235 and weighted average of 6.4%, a difference of 36.7%.
Unemployment Among Women with Children Under 18 years Correlation Summary
| Measurement | Immigrants from India | Barbadian |
| Minimum | 1.1% | 1.1% |
| Maximum | 16.2% | 18.5% |
| Range | 15.1% | 17.4% |
| Mean | 4.9% | 7.3% |
| Median | 4.3% | 6.5% |
| Interquartile 25% (IQ1) | 3.6% | 5.2% |
| Interquartile 75% (IQ3) | 5.2% | 9.2% |
| Interquartile Range (IQR) | 1.5% | 4.0% |
| Standard Deviation (Sample) | 2.5% | 3.4% |
| Standard Deviation (Population) | 2.5% | 3.4% |
Similar Demographics by Unemployment Among Women with Children Under 18 years
Demographics Similar to Immigrants from India by Unemployment Among Women with Children Under 18 years
In terms of unemployment among women with children under 18 years, the demographic groups most similar to Immigrants from India are Immigrants from Taiwan (4.7%, a difference of 0.11%), Tongan (4.7%, a difference of 0.22%), Swedish (4.7%, a difference of 0.27%), Immigrants from Hong Kong (4.7%, a difference of 0.42%), and Okinawan (4.7%, a difference of 1.3%).
| Demographics | Rating | Rank | Unemployment Among Women with Children Under 18 years |
| Norwegians | 100.0 /100 | #1 | Exceptional 4.4% |
| Hmong | 100.0 /100 | #2 | Exceptional 4.5% |
| Danes | 100.0 /100 | #3 | Exceptional 4.5% |
| Swedes | 100.0 /100 | #4 | Exceptional 4.7% |
| Tongans | 100.0 /100 | #5 | Exceptional 4.7% |
| Immigrants | Taiwan | 100.0 /100 | #6 | Exceptional 4.7% |
| Immigrants | India | 100.0 /100 | #7 | Exceptional 4.7% |
| Immigrants | Hong Kong | 100.0 /100 | #8 | Exceptional 4.7% |
| Okinawans | 99.9 /100 | #9 | Exceptional 4.7% |
| Czechs | 99.9 /100 | #10 | Exceptional 4.7% |
| Filipinos | 99.9 /100 | #11 | Exceptional 4.8% |
| Scandinavians | 99.9 /100 | #12 | Exceptional 4.8% |
| Bulgarians | 99.9 /100 | #13 | Exceptional 4.8% |
| Cambodians | 99.9 /100 | #14 | Exceptional 4.8% |
| Thais | 99.8 /100 | #15 | Exceptional 4.8% |
Demographics Similar to Barbadians by Unemployment Among Women with Children Under 18 years
In terms of unemployment among women with children under 18 years, the demographic groups most similar to Barbadians are Haitian (6.4%, a difference of 0.020%), Immigrants from Senegal (6.4%, a difference of 0.060%), Honduran (6.4%, a difference of 0.080%), Immigrants from Bangladesh (6.4%, a difference of 0.11%), and Mexican (6.4%, a difference of 0.14%).
| Demographics | Rating | Rank | Unemployment Among Women with Children Under 18 years |
| Cree | 0.0 /100 | #288 | Tragic 6.3% |
| Immigrants | Caribbean | 0.0 /100 | #289 | Tragic 6.4% |
| Blackfeet | 0.0 /100 | #290 | Tragic 6.4% |
| Immigrants | Guatemala | 0.0 /100 | #291 | Tragic 6.4% |
| Mexicans | 0.0 /100 | #292 | Tragic 6.4% |
| Immigrants | Bangladesh | 0.0 /100 | #293 | Tragic 6.4% |
| Hondurans | 0.0 /100 | #294 | Tragic 6.4% |
| Barbadians | 0.0 /100 | #295 | Tragic 6.4% |
| Haitians | 0.0 /100 | #296 | Tragic 6.4% |
| Immigrants | Senegal | 0.0 /100 | #297 | Tragic 6.4% |
| Immigrants | Latin America | 0.0 /100 | #298 | Tragic 6.4% |
| Jamaicans | 0.0 /100 | #299 | Tragic 6.4% |
| Immigrants | Jamaica | 0.0 /100 | #300 | Tragic 6.4% |
| Immigrants | Haiti | 0.0 /100 | #301 | Tragic 6.4% |
| Immigrants | Armenia | 0.0 /100 | #302 | Tragic 6.5% |