Immigrants from India vs Immigrants from Dominica Unemployment Among Women with Children Under 18 years
COMPARE
Immigrants from India
Immigrants from Dominica
Unemployment Among Women with Children Under 18 years
Unemployment Among Women with Children Under 18 years Comparison
Immigrants from India
Immigrants from Dominica
4.7%
UNEMPLOYMENT AMONG WOMEN WITH CHILDREN UNDER 18 YEARS
100.0/ 100
METRIC RATING
7th/ 347
METRIC RANK
7.0%
UNEMPLOYMENT AMONG WOMEN WITH CHILDREN UNDER 18 YEARS
0.0/ 100
METRIC RATING
325th/ 347
METRIC RANK
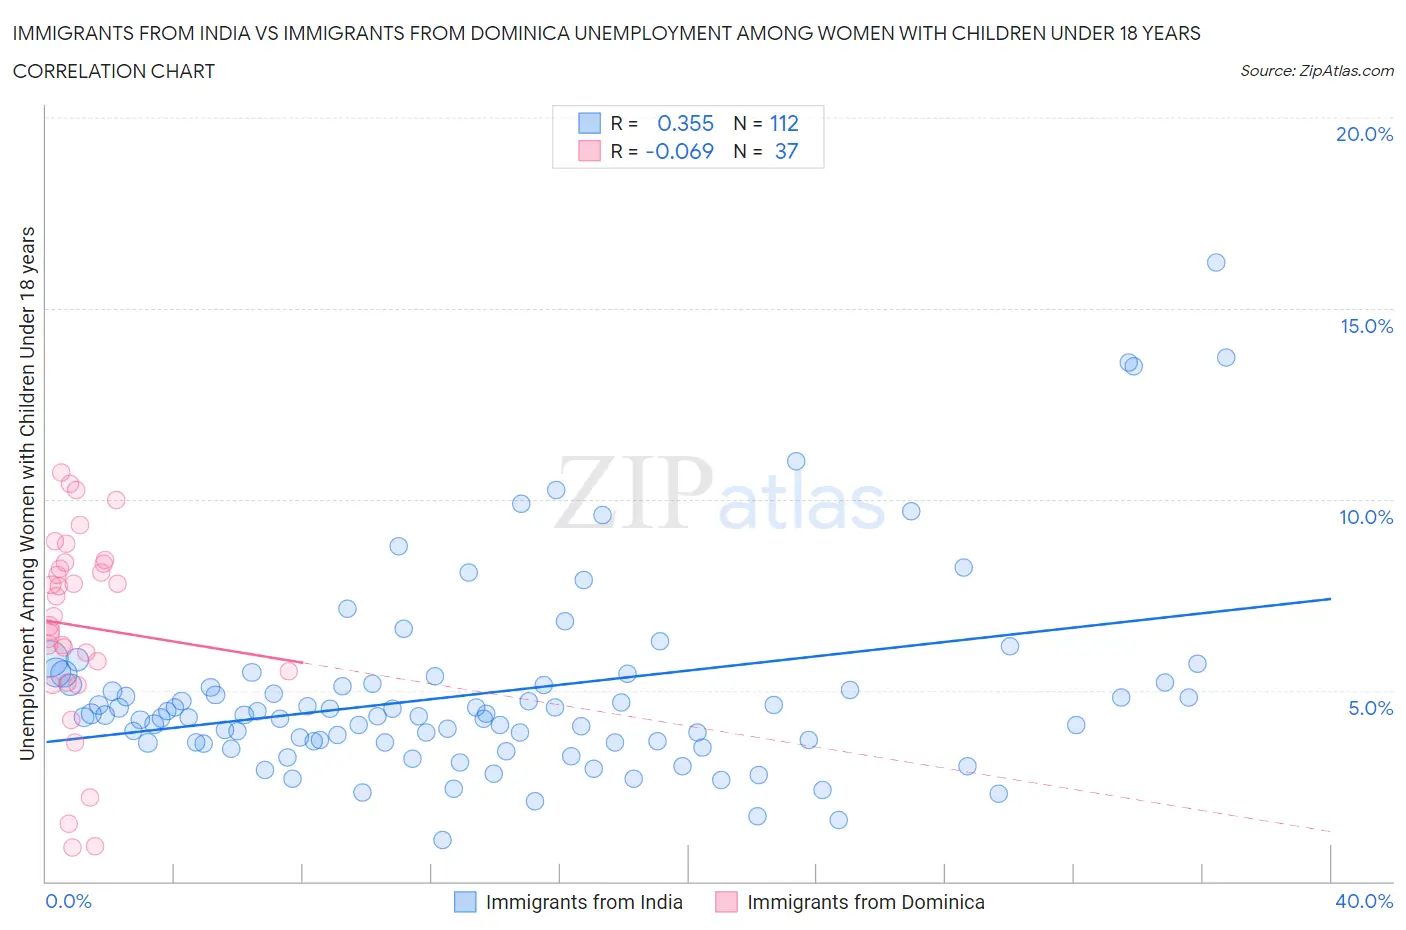
Immigrants from India vs Immigrants from Dominica Unemployment Among Women with Children Under 18 years Correlation Chart
The statistical analysis conducted on geographies consisting of 416,043,448 people shows a mild positive correlation between the proportion of Immigrants from India and unemployment rate among women with children under the age of 18 in the United States with a correlation coefficient (R) of 0.355 and weighted average of 4.7%. Similarly, the statistical analysis conducted on geographies consisting of 83,263,955 people shows a slight negative correlation between the proportion of Immigrants from Dominica and unemployment rate among women with children under the age of 18 in the United States with a correlation coefficient (R) of -0.069 and weighted average of 7.0%, a difference of 49.3%.
Unemployment Among Women with Children Under 18 years Correlation Summary
| Measurement | Immigrants from India | Immigrants from Dominica |
| Minimum | 1.1% | 0.90% |
| Maximum | 16.2% | 10.7% |
| Range | 15.1% | 9.8% |
| Mean | 4.9% | 6.7% |
| Median | 4.3% | 6.9% |
| Interquartile 25% (IQ1) | 3.6% | 5.3% |
| Interquartile 75% (IQ3) | 5.2% | 8.3% |
| Interquartile Range (IQR) | 1.5% | 3.0% |
| Standard Deviation (Sample) | 2.5% | 2.5% |
| Standard Deviation (Population) | 2.5% | 2.5% |
Similar Demographics by Unemployment Among Women with Children Under 18 years
Demographics Similar to Immigrants from India by Unemployment Among Women with Children Under 18 years
In terms of unemployment among women with children under 18 years, the demographic groups most similar to Immigrants from India are Immigrants from Taiwan (4.7%, a difference of 0.11%), Tongan (4.7%, a difference of 0.22%), Swedish (4.7%, a difference of 0.27%), Immigrants from Hong Kong (4.7%, a difference of 0.42%), and Okinawan (4.7%, a difference of 1.3%).
| Demographics | Rating | Rank | Unemployment Among Women with Children Under 18 years |
| Norwegians | 100.0 /100 | #1 | Exceptional 4.4% |
| Hmong | 100.0 /100 | #2 | Exceptional 4.5% |
| Danes | 100.0 /100 | #3 | Exceptional 4.5% |
| Swedes | 100.0 /100 | #4 | Exceptional 4.7% |
| Tongans | 100.0 /100 | #5 | Exceptional 4.7% |
| Immigrants | Taiwan | 100.0 /100 | #6 | Exceptional 4.7% |
| Immigrants | India | 100.0 /100 | #7 | Exceptional 4.7% |
| Immigrants | Hong Kong | 100.0 /100 | #8 | Exceptional 4.7% |
| Okinawans | 99.9 /100 | #9 | Exceptional 4.7% |
| Czechs | 99.9 /100 | #10 | Exceptional 4.7% |
| Filipinos | 99.9 /100 | #11 | Exceptional 4.8% |
| Scandinavians | 99.9 /100 | #12 | Exceptional 4.8% |
| Bulgarians | 99.9 /100 | #13 | Exceptional 4.8% |
| Cambodians | 99.9 /100 | #14 | Exceptional 4.8% |
| Thais | 99.8 /100 | #15 | Exceptional 4.8% |
Demographics Similar to Immigrants from Dominica by Unemployment Among Women with Children Under 18 years
In terms of unemployment among women with children under 18 years, the demographic groups most similar to Immigrants from Dominica are Chippewa (7.0%, a difference of 0.71%), Paiute (6.9%, a difference of 1.2%), Lumbee (7.1%, a difference of 1.6%), Pueblo (6.8%, a difference of 2.1%), and Houma (6.8%, a difference of 2.3%).
| Demographics | Rating | Rank | Unemployment Among Women with Children Under 18 years |
| Alaska Natives | 0.0 /100 | #318 | Tragic 6.7% |
| Central American Indians | 0.0 /100 | #319 | Tragic 6.7% |
| Immigrants | Belize | 0.0 /100 | #320 | Tragic 6.7% |
| U.S. Virgin Islanders | 0.0 /100 | #321 | Tragic 6.7% |
| Houma | 0.0 /100 | #322 | Tragic 6.8% |
| Pueblo | 0.0 /100 | #323 | Tragic 6.8% |
| Paiute | 0.0 /100 | #324 | Tragic 6.9% |
| Immigrants | Dominica | 0.0 /100 | #325 | Tragic 7.0% |
| Chippewa | 0.0 /100 | #326 | Tragic 7.0% |
| Lumbee | 0.0 /100 | #327 | Tragic 7.1% |
| Natives/Alaskans | 0.0 /100 | #328 | Tragic 7.2% |
| Blacks/African Americans | 0.0 /100 | #329 | Tragic 7.3% |
| Colville | 0.0 /100 | #330 | Tragic 7.4% |
| Hopi | 0.0 /100 | #331 | Tragic 7.4% |
| Dominicans | 0.0 /100 | #332 | Tragic 7.5% |