Immigrants from India vs Greek Unemployment Among Women with Children Under 18 years
COMPARE
Immigrants from India
Greek
Unemployment Among Women with Children Under 18 years
Unemployment Among Women with Children Under 18 years Comparison
Immigrants from India
Greeks
4.7%
UNEMPLOYMENT AMONG WOMEN WITH CHILDREN UNDER 18 YEARS
100.0/ 100
METRIC RATING
7th/ 347
METRIC RANK
5.0%
UNEMPLOYMENT AMONG WOMEN WITH CHILDREN UNDER 18 YEARS
99.0/ 100
METRIC RATING
40th/ 347
METRIC RANK
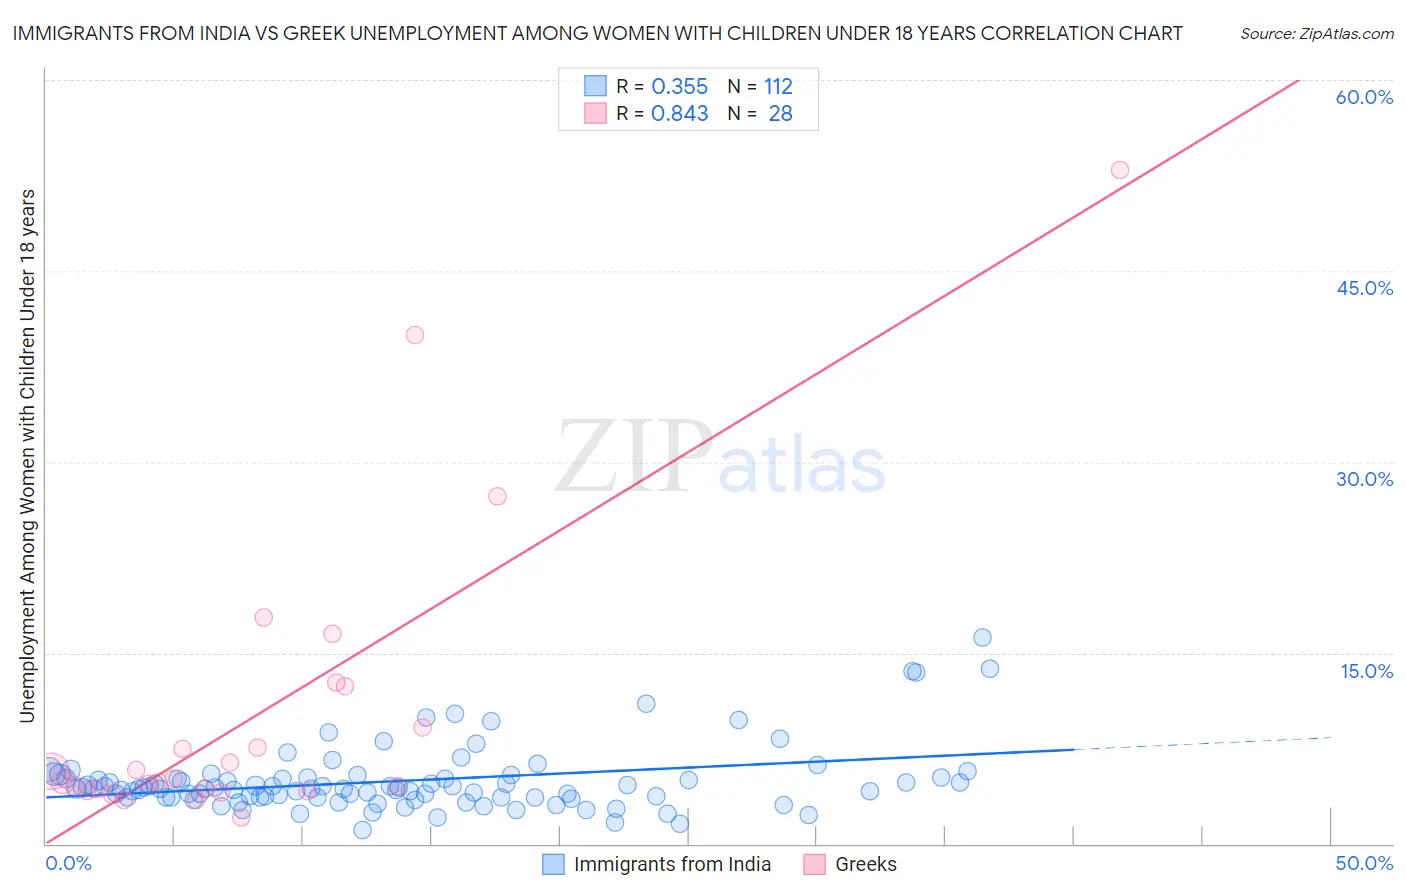
Immigrants from India vs Greek Unemployment Among Women with Children Under 18 years Correlation Chart
The statistical analysis conducted on geographies consisting of 416,043,448 people shows a mild positive correlation between the proportion of Immigrants from India and unemployment rate among women with children under the age of 18 in the United States with a correlation coefficient (R) of 0.355 and weighted average of 4.7%. Similarly, the statistical analysis conducted on geographies consisting of 453,324,679 people shows a very strong positive correlation between the proportion of Greeks and unemployment rate among women with children under the age of 18 in the United States with a correlation coefficient (R) of 0.843 and weighted average of 5.0%, a difference of 7.1%.
Unemployment Among Women with Children Under 18 years Correlation Summary
| Measurement | Immigrants from India | Greek |
| Minimum | 1.1% | 2.0% |
| Maximum | 16.2% | 52.9% |
| Range | 15.1% | 50.9% |
| Mean | 4.9% | 10.1% |
| Median | 4.3% | 5.0% |
| Interquartile 25% (IQ1) | 3.6% | 4.3% |
| Interquartile 75% (IQ3) | 5.2% | 10.7% |
| Interquartile Range (IQR) | 1.5% | 6.5% |
| Standard Deviation (Sample) | 2.5% | 11.8% |
| Standard Deviation (Population) | 2.5% | 11.6% |
Similar Demographics by Unemployment Among Women with Children Under 18 years
Demographics Similar to Immigrants from India by Unemployment Among Women with Children Under 18 years
In terms of unemployment among women with children under 18 years, the demographic groups most similar to Immigrants from India are Immigrants from Taiwan (4.7%, a difference of 0.11%), Tongan (4.7%, a difference of 0.22%), Swedish (4.7%, a difference of 0.27%), Immigrants from Hong Kong (4.7%, a difference of 0.42%), and Okinawan (4.7%, a difference of 1.3%).
| Demographics | Rating | Rank | Unemployment Among Women with Children Under 18 years |
| Norwegians | 100.0 /100 | #1 | Exceptional 4.4% |
| Hmong | 100.0 /100 | #2 | Exceptional 4.5% |
| Danes | 100.0 /100 | #3 | Exceptional 4.5% |
| Swedes | 100.0 /100 | #4 | Exceptional 4.7% |
| Tongans | 100.0 /100 | #5 | Exceptional 4.7% |
| Immigrants | Taiwan | 100.0 /100 | #6 | Exceptional 4.7% |
| Immigrants | India | 100.0 /100 | #7 | Exceptional 4.7% |
| Immigrants | Hong Kong | 100.0 /100 | #8 | Exceptional 4.7% |
| Okinawans | 99.9 /100 | #9 | Exceptional 4.7% |
| Czechs | 99.9 /100 | #10 | Exceptional 4.7% |
| Filipinos | 99.9 /100 | #11 | Exceptional 4.8% |
| Scandinavians | 99.9 /100 | #12 | Exceptional 4.8% |
| Bulgarians | 99.9 /100 | #13 | Exceptional 4.8% |
| Cambodians | 99.9 /100 | #14 | Exceptional 4.8% |
| Thais | 99.8 /100 | #15 | Exceptional 4.8% |
Demographics Similar to Greeks by Unemployment Among Women with Children Under 18 years
In terms of unemployment among women with children under 18 years, the demographic groups most similar to Greeks are Immigrants from Bosnia and Herzegovina (5.0%, a difference of 0.060%), Eastern European (5.0%, a difference of 0.14%), Turkish (5.0%, a difference of 0.19%), English (5.0%, a difference of 0.25%), and Immigrants from Moldova (5.0%, a difference of 0.26%).
| Demographics | Rating | Rank | Unemployment Among Women with Children Under 18 years |
| Croatians | 99.3 /100 | #33 | Exceptional 5.0% |
| Immigrants | South Central Asia | 99.2 /100 | #34 | Exceptional 5.0% |
| Luxembourgers | 99.2 /100 | #35 | Exceptional 5.0% |
| Mongolians | 99.2 /100 | #36 | Exceptional 5.0% |
| Poles | 99.2 /100 | #37 | Exceptional 5.0% |
| Bhutanese | 99.2 /100 | #38 | Exceptional 5.0% |
| English | 99.1 /100 | #39 | Exceptional 5.0% |
| Greeks | 99.0 /100 | #40 | Exceptional 5.0% |
| Immigrants | Bosnia and Herzegovina | 99.0 /100 | #41 | Exceptional 5.0% |
| Eastern Europeans | 98.9 /100 | #42 | Exceptional 5.0% |
| Turks | 98.9 /100 | #43 | Exceptional 5.0% |
| Immigrants | Moldova | 98.9 /100 | #44 | Exceptional 5.0% |
| Immigrants | Malaysia | 98.8 /100 | #45 | Exceptional 5.0% |
| Immigrants | Korea | 98.7 /100 | #46 | Exceptional 5.0% |
| British | 98.7 /100 | #47 | Exceptional 5.0% |