Immigrants from India vs Barbadian Master's Degree

COMPARE

Immigrants from India
Race
Ancestry
AfghanAfricanAlaska NativeAlaskan AthabascanAlbanianAleutAlsatianAmericanApacheArabArapahoArgentineanArmenianAssyrian/Chaldean/SyriacAustralianAustrianBahamianBangladeshiBasqueBelgianBelizeanBermudanBhutaneseBlackfeetBolivianBrazilianBritishBritish West IndianBulgarianBurmeseCajunCambodianCanadianCape VerdeanCarpatho RusynCelticCentral AmericanCentral American IndianCherokeeCheyenneChickasawChileanChineseChippewaChoctawColombianColvilleComancheCosta RicanCreeCreekCroatianCrowCubanCypriotCzechCzechoslovakianDanishDelawareDominicanDutchDutch West IndianEastern EuropeanEcuadorianEgyptianEnglishEstonianEthiopianEuropeanFijianFilipinoFinnishFrenchFrench American IndianFrench CanadianGermanGerman RussianGhanaianGreekGuamanian/ChamorroGuatemalanGuyaneseHaitianHmongHonduranHopiHoumaHungarianIcelanderIndian (Asian)IndonesianInupiatIranianIraqiIrishIroquoisIsraeliItalianJamaicanJapaneseJordanianKenyanKiowaKoreanLaotianLatvianLebaneseLiberianLithuanianLumbeeLuxembourgerMacedonianMalaysianMalteseMarshalleseMenomineeMexicanMexican American IndianMongolianMoroccanNative HawaiianNavajoNepaleseNew ZealanderNicaraguanNigerianNorthern EuropeanNorwegianOkinawanOsageOttawaPaiutePakistaniPalestinianPanamanianParaguayanPennsylvania GermanPeruvianPimaPolishPortuguesePotawatomiPuebloPuerto RicanPuget Sound SalishRomanianRussianSalvadoranSamoanScandinavianScotch-IrishScottishSeminoleSenegaleseSerbianShoshoneSierra LeoneanSiouxSlavicSlovakSloveneSomaliSouth AfricanSouth AmericanSouth American IndianSoviet UnionSpaniardSpanishSpanish AmericanSpanish American IndianSri LankanSubsaharan AfricanSudaneseSwedishSwissSyrianTaiwaneseThaiTlingit-HaidaTohono O'OdhamTonganTrinidadian and TobagonianTsimshianTurkishU.S. Virgin IslanderUgandanUkrainianUruguayanUteVenezuelanVietnameseWelshWest IndianYakamaYaquiYugoslavianYumanYup'ikZimbabwean
Immigration
NonimmigrantsImmigrantsAfghanistanAfricaAlbaniaArgentinaArmeniaAsiaAustraliaAustriaBahamasBangladeshBarbadosBelarusBelgiumBelizeBoliviaBosnia and HerzegovinaBrazilBulgariaBurma/MyanmarCabo VerdeCambodiaCameroonCanadaCaribbeanCentral AmericaChileChinaColombiaCongoCosta RicaCroatiaCubaCzechoslovakiaDenmarkDominicaDominican RepublicEastern AfricaEastern AsiaEastern EuropeEcuadorEgyptEl SalvadorEnglandEritreaEthiopiaEuropeFijiFranceGermanyGhanaGreeceGrenadaGuatemalaGuyanaHaitiHondurasHong KongHungaryIndiaIndonesiaIranIraqIrelandIsraelItalyJamaicaJapanJordanKazakhstanKenyaKoreaKuwaitLaosLatin AmericaLatviaLebanonLiberiaLithuaniaMalaysiaMexicoMicronesiaMiddle AfricaMoldovaMoroccoNepalNetherlandsNicaraguaNigeriaNorth AmericaNorth MacedoniaNorthern AfricaNorthern EuropeNorwayOceaniaPakistanPanamaPeruPhilippinesPolandPortugalRomaniaRussiaSaudi ArabiaScotlandSenegalSerbiaSierra LeoneSingaporeSomaliaSouth AfricaSouth AmericaSouth Central AsiaSouth Eastern AsiaSouthern EuropeSpainSri LankaSt. Vincent and the GrenadinesSudanSwedenSwitzerlandSyriaTaiwanThailandTrinidad and TobagoTurkeyUgandaUkraineUruguayUzbekistanVenezuelaVietnamWest IndiesWestern AfricaWestern AsiaWestern EuropeYemenZaireZimbabweAzores
Barbadian
Race
Ancestry
AfghanAfricanAlaska NativeAlaskan AthabascanAlbanianAleutAlsatianAmericanApacheArabArapahoArgentineanArmenianAssyrian/Chaldean/SyriacAustralianAustrianBahamianBangladeshiBarbadianBasqueBelgianBelizeanBermudanBhutaneseBlackfeetBolivianBrazilianBritishBritish West IndianBulgarianBurmeseCajunCambodianCanadianCape VerdeanCarpatho RusynCelticCentral AmericanCentral American IndianCherokeeCheyenneChickasawChileanChineseChippewaChoctawColombianColvilleComancheCosta RicanCreeCreekCroatianCrowCubanCypriotCzechCzechoslovakianDanishDelawareDominicanDutchDutch West IndianEastern EuropeanEcuadorianEgyptianEnglishEstonianEthiopianEuropeanFijianFilipinoFinnishFrenchFrench American IndianFrench CanadianGermanGerman RussianGhanaianGreekGuamanian/ChamorroGuatemalanGuyaneseHaitianHmongHonduranHopiHoumaHungarianIcelanderIndian (Asian)IndonesianInupiatIranianIraqiIrishIroquoisIsraeliItalianJamaicanJapaneseJordanianKenyanKiowaKoreanLaotianLatvianLebaneseLiberianLithuanianLumbeeLuxembourgerMacedonianMalaysianMalteseMarshalleseMenomineeMexicanMexican American IndianMongolianMoroccanNative HawaiianNavajoNepaleseNew ZealanderNicaraguanNigerianNorthern EuropeanNorwegianOkinawanOsageOttawaPaiutePakistaniPalestinianPanamanianParaguayanPennsylvania GermanPeruvianPimaPolishPortuguesePotawatomiPuebloPuerto RicanPuget Sound SalishRomanianRussianSalvadoranSamoanScandinavianScotch-IrishScottishSeminoleSenegaleseSerbianShoshoneSierra LeoneanSiouxSlavicSlovakSloveneSomaliSouth AfricanSouth AmericanSouth American IndianSoviet UnionSpaniardSpanishSpanish AmericanSpanish American IndianSri LankanSubsaharan AfricanSudaneseSwedishSwissSyrianTaiwaneseThaiTlingit-HaidaTohono O'OdhamTonganTrinidadian and TobagonianTsimshianTurkishU.S. Virgin IslanderUgandanUkrainianUruguayanUteVenezuelanVietnameseWelshWest IndianYakamaYaquiYugoslavianYumanYup'ikZimbabwean
Immigration
NonimmigrantsImmigrantsAfghanistanAfricaAlbaniaArgentinaArmeniaAsiaAustraliaAustriaBahamasBangladeshBarbadosBelarusBelgiumBelizeBoliviaBosnia and HerzegovinaBrazilBulgariaBurma/MyanmarCabo VerdeCambodiaCameroonCanadaCaribbeanCentral AmericaChileChinaColombiaCongoCosta RicaCroatiaCubaCzechoslovakiaDenmarkDominicaDominican RepublicEastern AfricaEastern AsiaEastern EuropeEcuadorEgyptEl SalvadorEnglandEritreaEthiopiaEuropeFijiFranceGermanyGhanaGreeceGrenadaGuatemalaGuyanaHaitiHondurasHong KongHungaryIndonesiaIranIraqIrelandIsraelItalyJamaicaJapanJordanKazakhstanKenyaKoreaKuwaitLaosLatin AmericaLatviaLebanonLiberiaLithuaniaMalaysiaMexicoMicronesiaMiddle AfricaMoldovaMoroccoNepalNetherlandsNicaraguaNigeriaNorth AmericaNorth MacedoniaNorthern AfricaNorthern EuropeNorwayOceaniaPakistanPanamaPeruPhilippinesPolandPortugalRomaniaRussiaSaudi ArabiaScotlandSenegalSerbiaSierra LeoneSingaporeSomaliaSouth AfricaSouth AmericaSouth Central AsiaSouth Eastern AsiaSouthern EuropeSpainSri LankaSt. Vincent and the GrenadinesSudanSwedenSwitzerlandSyriaTaiwanThailandTrinidad and TobagoTurkeyUgandaUkraineUruguayUzbekistanVenezuelaVietnamWest IndiesWestern AfricaWestern AsiaWestern EuropeYemenZaireZimbabweAzores
Master's Degree
Income
Poverty
Unemployment
Labor Participation
Family Structure
Vehicle Availability
Education Level
Disability

Master's Degree Comparison

Immigrants from India

Barbadians

Exceptional
Fair
22.3%
MASTER'S DEGREE
100.0/ 100
METRIC RATING
6th/ 347
METRIC RANK
14.7%
MASTER'S DEGREE
38.3/ 100
METRIC RATING
185th/ 347
METRIC RANK

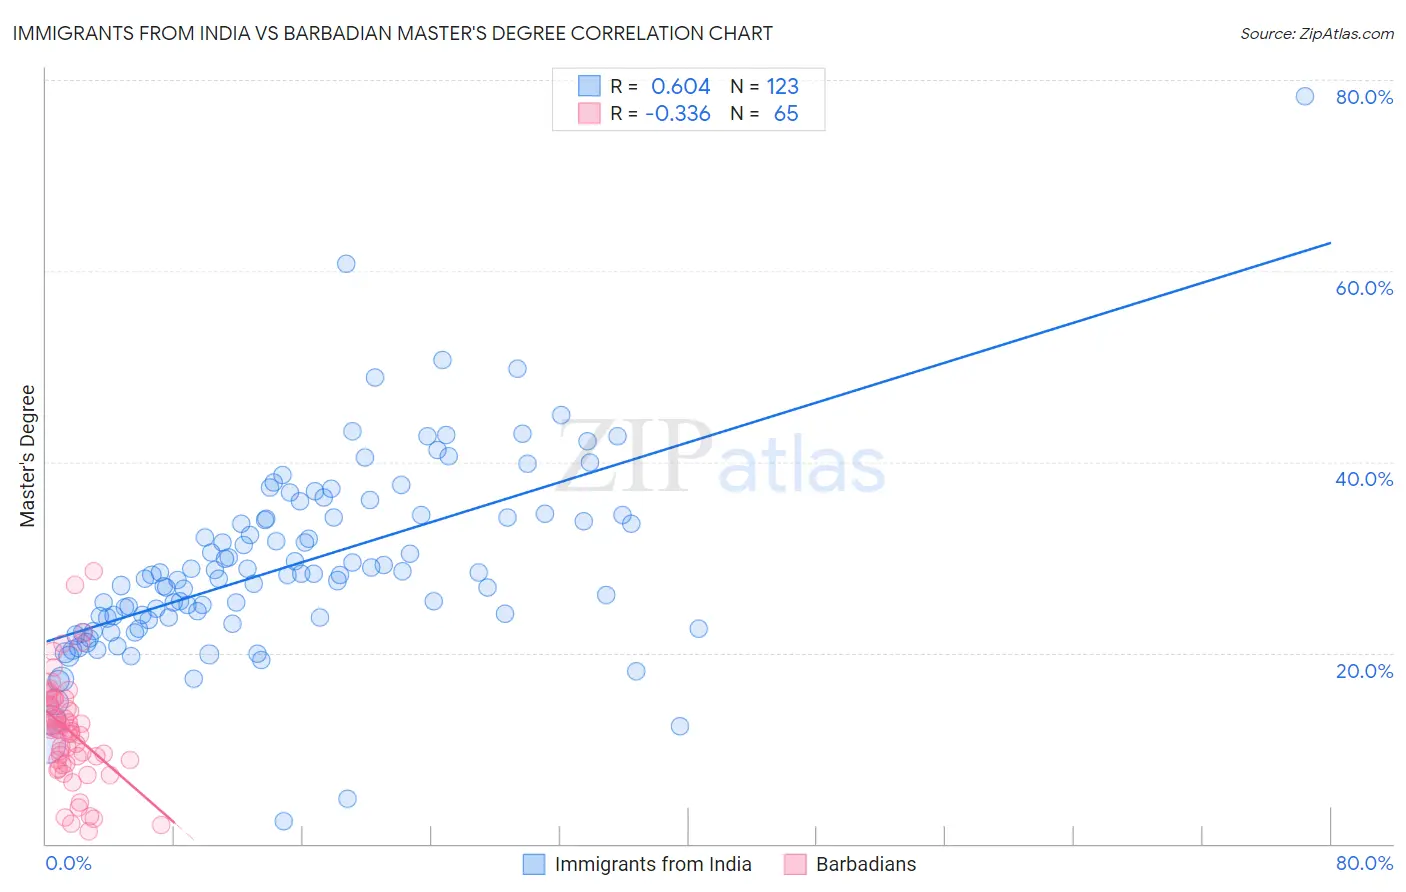
Immigrants from India vs Barbadian Master's Degree Correlation Chart

The statistical analysis conducted on geographies consisting of 433,961,661 people shows a significant positive correlation between the proportion of Immigrants from India and percentage of population with at least master's degree education in the United States with a correlation coefficient (R) of 0.604 and weighted average of 22.3%. Similarly, the statistical analysis conducted on geographies consisting of 141,295,257 people shows a mild negative correlation between the proportion of Barbadians and percentage of population with at least master's degree education in the United States with a correlation coefficient (R) of -0.336 and weighted average of 14.7%, a difference of 51.9%.
Immigrants from India vs Barbadian Master's Degree

Master's Degree Correlation Summary

MeasurementImmigrants from IndiaBarbadian
Minimum2.4%1.3%
Maximum78.4%28.6%
Range76.0%27.2%
Mean29.2%11.8%
Median28.2%12.0%
Interquartile 25% (IQ1)23.4%8.6%
Interquartile 75% (IQ3)34.2%14.8%
Interquartile Range (IQR)10.8%6.3%
Standard Deviation (Sample)10.1%5.5%
Standard Deviation (Population)10.0%5.5%

Similar Demographics by Master's Degree

Demographics Similar to Immigrants from India by Master's Degree

In terms of master's degree, the demographic groups most similar to Immigrants from India are Iranian (22.3%, a difference of 0.21%), Immigrants from Taiwan (22.5%, a difference of 0.68%), Immigrants from Israel (22.6%, a difference of 1.5%), Okinawan (22.6%, a difference of 1.5%), and Cypriot (21.8%, a difference of 2.4%).
DemographicsRating | RankMaster's Degree
Immigrants | Singapore
100.0
/100
|
#1
Exceptional
23.4%
Filipinos
100.0
/100
|
#2
Exceptional
23.4%
Immigrants | Israel
100.0
/100
|
#3
Exceptional
22.6%
Okinawans
100.0
/100
|
#4
Exceptional
22.6%
Immigrants | Taiwan
100.0
/100
|
#5
Exceptional
22.5%
Immigrants | India
100.0
/100
|
#6
Exceptional
22.3%
Iranians
100.0
/100
|
#7
Exceptional
22.3%
Cypriots
100.0
/100
|
#8
Exceptional
21.8%
Thais
100.0
/100
|
#9
Exceptional
21.7%
Immigrants | Iran
100.0
/100
|
#10
Exceptional
21.6%
Immigrants | China
100.0
/100
|
#11
Exceptional
21.2%
Eastern Europeans
100.0
/100
|
#12
Exceptional
21.1%
Immigrants | Australia
100.0
/100
|
#13
Exceptional
20.9%
Immigrants | Switzerland
100.0
/100
|
#14
Exceptional
20.9%
Immigrants | Eastern Asia
100.0
/100
|
#15
Exceptional
20.8%

Demographics Similar to Barbadians by Master's Degree

In terms of master's degree, the demographic groups most similar to Barbadians are Immigrants from Zaire (14.7%, a difference of 0.16%), Immigrants from Oceania (14.7%, a difference of 0.16%), Sri Lankan (14.7%, a difference of 0.18%), Basque (14.7%, a difference of 0.24%), and Czech (14.7%, a difference of 0.28%).
DemographicsRating | RankMaster's Degree
English
45.0
/100
|
#178
Average
14.8%
Immigrants | Iraq
41.3
/100
|
#179
Average
14.8%
Celtics
41.3
/100
|
#180
Average
14.8%
Swiss
41.1
/100
|
#181
Average
14.7%
Czechs
40.4
/100
|
#182
Average
14.7%
Sri Lankans
39.6
/100
|
#183
Fair
14.7%
Immigrants | Zaire
39.5
/100
|
#184
Fair
14.7%
Barbadians
38.3
/100
|
#185
Fair
14.7%
Immigrants | Oceania
37.1
/100
|
#186
Fair
14.7%
Basques
36.5
/100
|
#187
Fair
14.7%
Immigrants | Costa Rica
36.2
/100
|
#188
Fair
14.7%
Immigrants | Immigrants
36.0
/100
|
#189
Fair
14.6%
Spaniards
35.8
/100
|
#190
Fair
14.6%
Welsh
34.2
/100
|
#191
Fair
14.6%
Immigrants | Middle Africa
33.6
/100
|
#192
Fair
14.6%