Immigrants from Hungary vs Hispanic or Latino Unemployment
COMPARE
Immigrants from Hungary
Hispanic or Latino
Unemployment
Unemployment Comparison
Immigrants from Hungary
Hispanics or Latinos
5.1%
UNEMPLOYMENT
85.6/ 100
METRIC RATING
138th/ 347
METRIC RANK
5.9%
UNEMPLOYMENT
0.0/ 100
METRIC RATING
272nd/ 347
METRIC RANK
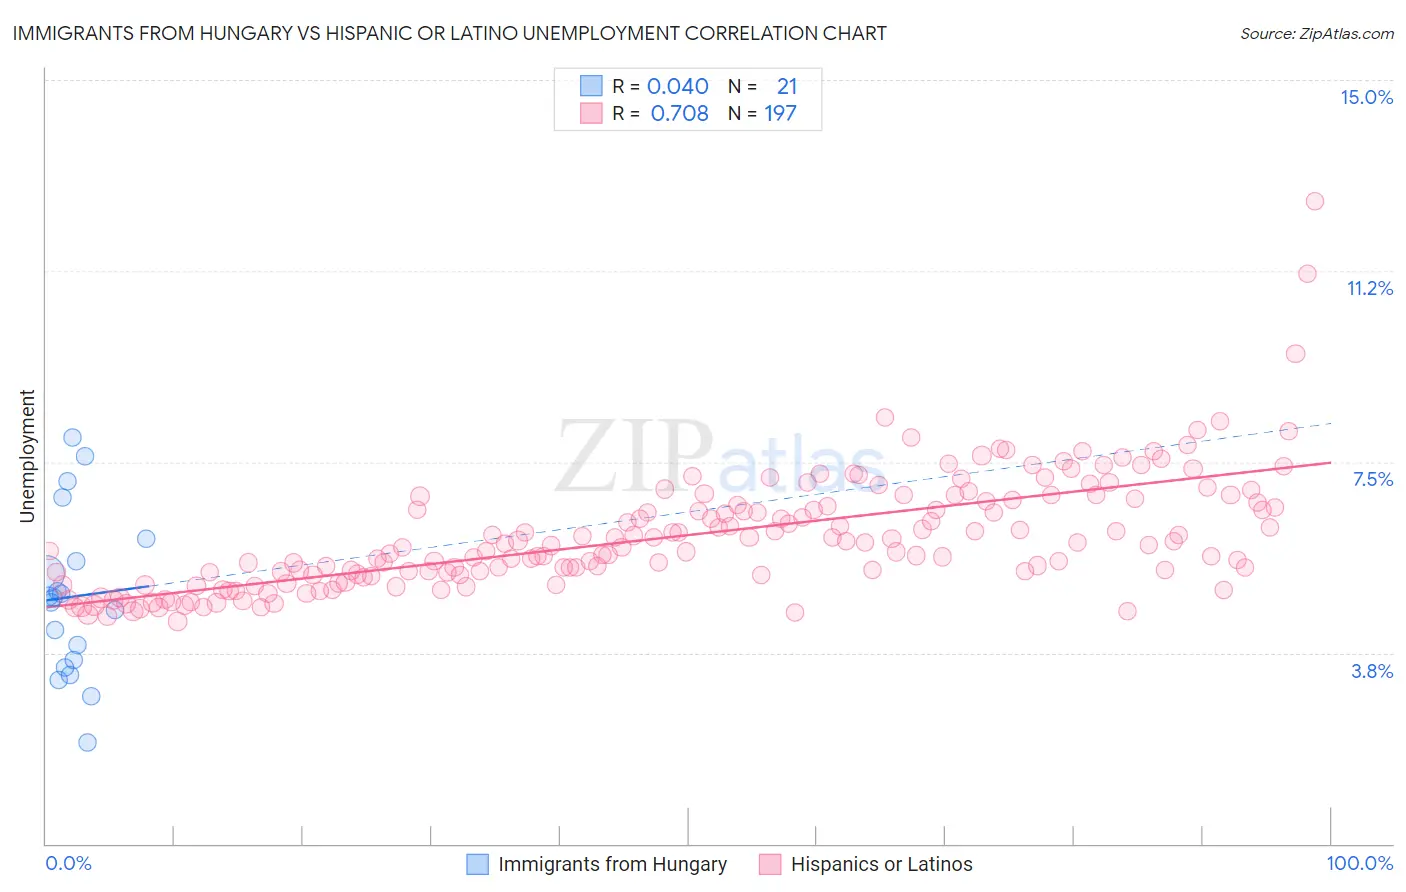
Immigrants from Hungary vs Hispanic or Latino Unemployment Correlation Chart
The statistical analysis conducted on geographies consisting of 195,624,152 people shows no correlation between the proportion of Immigrants from Hungary and unemployment in the United States with a correlation coefficient (R) of 0.040 and weighted average of 5.1%. Similarly, the statistical analysis conducted on geographies consisting of 570,210,949 people shows a strong positive correlation between the proportion of Hispanics or Latinos and unemployment in the United States with a correlation coefficient (R) of 0.708 and weighted average of 5.9%, a difference of 15.4%.
Unemployment Correlation Summary
| Measurement | Immigrants from Hungary | Hispanic or Latino |
| Minimum | 2.0% | 4.4% |
| Maximum | 8.0% | 12.6% |
| Range | 6.0% | 8.3% |
| Mean | 4.9% | 6.0% |
| Median | 4.8% | 5.9% |
| Interquartile 25% (IQ1) | 3.5% | 5.3% |
| Interquartile 75% (IQ3) | 5.8% | 6.7% |
| Interquartile Range (IQR) | 2.2% | 1.4% |
| Standard Deviation (Sample) | 1.6% | 1.1% |
| Standard Deviation (Population) | 1.5% | 1.1% |
Similar Demographics by Unemployment
Demographics Similar to Immigrants from Hungary by Unemployment
In terms of unemployment, the demographic groups most similar to Immigrants from Hungary are Immigrants from Saudi Arabia (5.1%, a difference of 0.010%), Pakistani (5.1%, a difference of 0.040%), Immigrants from Burma/Myanmar (5.1%, a difference of 0.080%), Immigrants from Spain (5.1%, a difference of 0.080%), and Immigrants from Europe (5.1%, a difference of 0.090%).
| Demographics | Rating | Rank | Unemployment |
| Immigrants | Croatia | 86.8 /100 | #131 | Excellent 5.1% |
| Immigrants | Ethiopia | 86.7 /100 | #132 | Excellent 5.1% |
| Immigrants | Jordan | 86.6 /100 | #133 | Excellent 5.1% |
| Immigrants | Europe | 86.3 /100 | #134 | Excellent 5.1% |
| Immigrants | Burma/Myanmar | 86.2 /100 | #135 | Excellent 5.1% |
| Immigrants | Spain | 86.2 /100 | #136 | Excellent 5.1% |
| Immigrants | Saudi Arabia | 85.6 /100 | #137 | Excellent 5.1% |
| Immigrants | Hungary | 85.6 /100 | #138 | Excellent 5.1% |
| Pakistanis | 85.3 /100 | #139 | Excellent 5.1% |
| Immigrants | Denmark | 84.3 /100 | #140 | Excellent 5.1% |
| Palestinians | 83.4 /100 | #141 | Excellent 5.1% |
| Immigrants | Pakistan | 83.2 /100 | #142 | Excellent 5.1% |
| Immigrants | Chile | 82.8 /100 | #143 | Excellent 5.1% |
| Indonesians | 82.3 /100 | #144 | Excellent 5.1% |
| Immigrants | Norway | 81.8 /100 | #145 | Excellent 5.1% |
Demographics Similar to Hispanics or Latinos by Unemployment
In terms of unemployment, the demographic groups most similar to Hispanics or Latinos are Immigrants from Fiji (5.9%, a difference of 0.17%), Bahamian (5.9%, a difference of 0.46%), Immigrants from Latin America (5.9%, a difference of 0.67%), Mexican (5.9%, a difference of 0.68%), and Blackfeet (5.8%, a difference of 0.92%).
| Demographics | Rating | Rank | Unemployment |
| Nigerians | 0.1 /100 | #265 | Tragic 5.8% |
| Mexican American Indians | 0.1 /100 | #266 | Tragic 5.8% |
| Immigrants | Nigeria | 0.1 /100 | #267 | Tragic 5.8% |
| Immigrants | Sierra Leone | 0.1 /100 | #268 | Tragic 5.8% |
| Immigrants | El Salvador | 0.1 /100 | #269 | Tragic 5.8% |
| Blackfeet | 0.1 /100 | #270 | Tragic 5.8% |
| Mexicans | 0.1 /100 | #271 | Tragic 5.9% |
| Hispanics or Latinos | 0.0 /100 | #272 | Tragic 5.9% |
| Immigrants | Fiji | 0.0 /100 | #273 | Tragic 5.9% |
| Bahamians | 0.0 /100 | #274 | Tragic 5.9% |
| Immigrants | Latin America | 0.0 /100 | #275 | Tragic 5.9% |
| Immigrants | Central America | 0.0 /100 | #276 | Tragic 6.0% |
| Armenians | 0.0 /100 | #277 | Tragic 6.0% |
| Ghanaians | 0.0 /100 | #278 | Tragic 6.0% |
| Immigrants | Mexico | 0.0 /100 | #279 | Tragic 6.0% |