Immigrants from Bosnia and Herzegovina vs Iraqi Unemployment
COMPARE
Immigrants from Bosnia and Herzegovina
Iraqi
Unemployment
Unemployment Comparison
Immigrants from Bosnia and Herzegovina
Iraqis
4.8%
UNEMPLOYMENT
99.7/ 100
METRIC RATING
41st/ 347
METRIC RANK
5.4%
UNEMPLOYMENT
18.1/ 100
METRIC RATING
211th/ 347
METRIC RANK
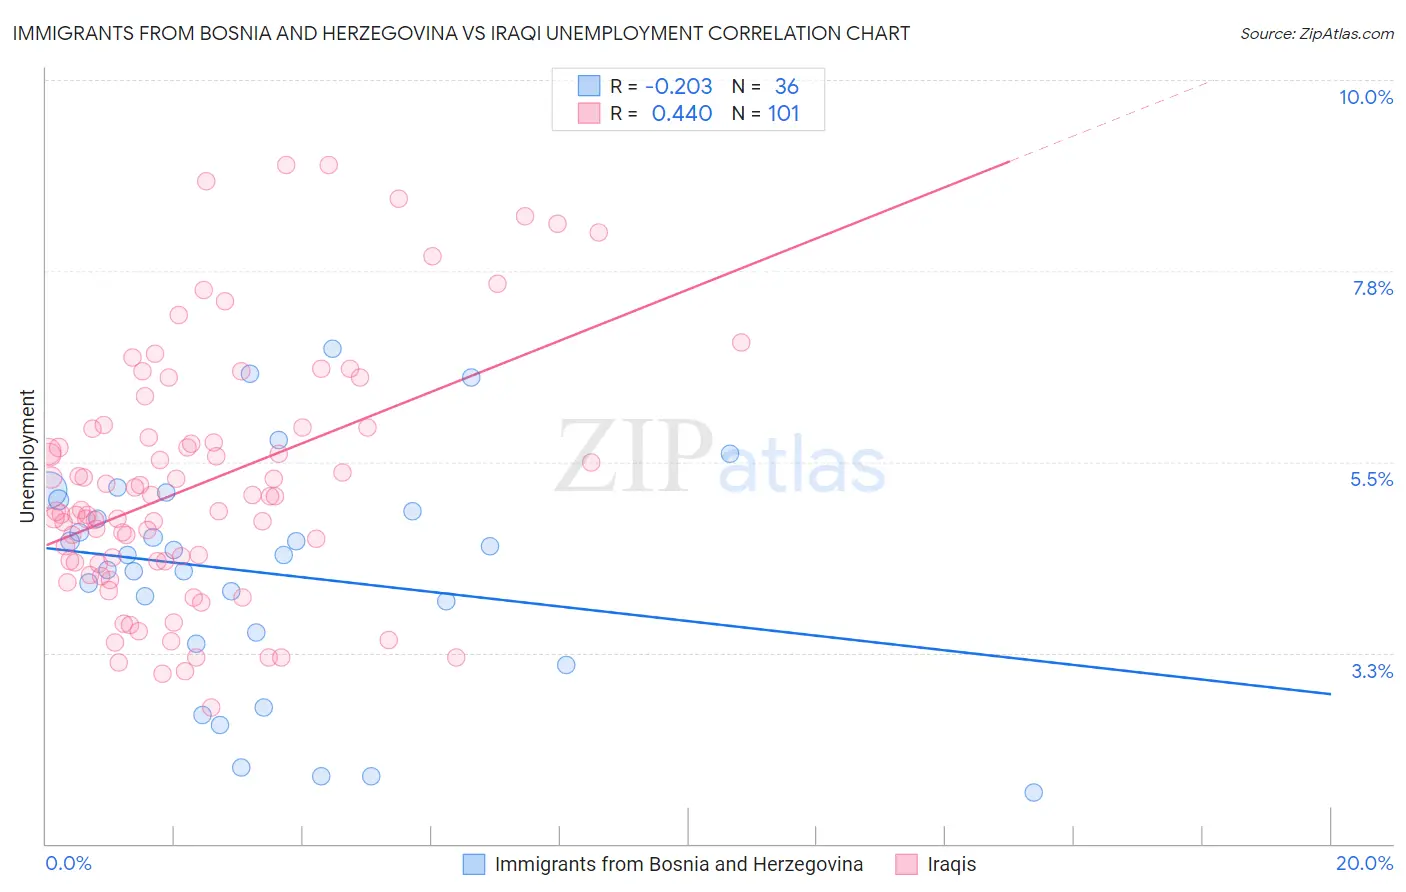
Immigrants from Bosnia and Herzegovina vs Iraqi Unemployment Correlation Chart
The statistical analysis conducted on geographies consisting of 156,781,298 people shows a weak negative correlation between the proportion of Immigrants from Bosnia and Herzegovina and unemployment in the United States with a correlation coefficient (R) of -0.203 and weighted average of 4.8%. Similarly, the statistical analysis conducted on geographies consisting of 170,626,447 people shows a moderate positive correlation between the proportion of Iraqis and unemployment in the United States with a correlation coefficient (R) of 0.440 and weighted average of 5.4%, a difference of 12.1%.
Unemployment Correlation Summary
| Measurement | Immigrants from Bosnia and Herzegovina | Iraqi |
| Minimum | 1.6% | 2.6% |
| Maximum | 6.8% | 9.0% |
| Range | 5.2% | 6.4% |
| Mean | 4.2% | 5.2% |
| Median | 4.4% | 4.9% |
| Interquartile 25% (IQ1) | 3.4% | 4.3% |
| Interquartile 75% (IQ3) | 5.0% | 5.9% |
| Interquartile Range (IQR) | 1.6% | 1.6% |
| Standard Deviation (Sample) | 1.3% | 1.5% |
| Standard Deviation (Population) | 1.3% | 1.4% |
Similar Demographics by Unemployment
Demographics Similar to Immigrants from Bosnia and Herzegovina by Unemployment
In terms of unemployment, the demographic groups most similar to Immigrants from Bosnia and Herzegovina are Northern European (4.8%, a difference of 0.030%), Lithuanian (4.8%, a difference of 0.040%), Bolivian (4.8%, a difference of 0.19%), Czechoslovakian (4.8%, a difference of 0.38%), and Tongan (4.8%, a difference of 0.45%).
| Demographics | Rating | Rank | Unemployment |
| Immigrants | Bolivia | 99.8 /100 | #34 | Exceptional 4.8% |
| Scotch-Irish | 99.8 /100 | #35 | Exceptional 4.8% |
| Tongans | 99.7 /100 | #36 | Exceptional 4.8% |
| Czechoslovakians | 99.7 /100 | #37 | Exceptional 4.8% |
| Bolivians | 99.7 /100 | #38 | Exceptional 4.8% |
| Lithuanians | 99.7 /100 | #39 | Exceptional 4.8% |
| Northern Europeans | 99.7 /100 | #40 | Exceptional 4.8% |
| Immigrants | Bosnia and Herzegovina | 99.7 /100 | #41 | Exceptional 4.8% |
| Filipinos | 99.5 /100 | #42 | Exceptional 4.8% |
| Yugoslavians | 99.5 /100 | #43 | Exceptional 4.8% |
| Austrians | 99.5 /100 | #44 | Exceptional 4.8% |
| French | 99.5 /100 | #45 | Exceptional 4.8% |
| Immigrants | Nepal | 99.4 /100 | #46 | Exceptional 4.8% |
| Immigrants | Taiwan | 99.4 /100 | #47 | Exceptional 4.8% |
| Immigrants | Scotland | 99.3 /100 | #48 | Exceptional 4.9% |
Demographics Similar to Iraqis by Unemployment
In terms of unemployment, the demographic groups most similar to Iraqis are Ugandan (5.4%, a difference of 0.010%), Immigrants from Iraq (5.4%, a difference of 0.050%), Immigrants from Iran (5.4%, a difference of 0.070%), Portuguese (5.4%, a difference of 0.10%), and Creek (5.4%, a difference of 0.13%).
| Demographics | Rating | Rank | Unemployment |
| Immigrants | Ukraine | 24.9 /100 | #204 | Fair 5.3% |
| Native Hawaiians | 24.1 /100 | #205 | Fair 5.3% |
| Immigrants | Peru | 22.7 /100 | #206 | Fair 5.4% |
| Creek | 19.4 /100 | #207 | Poor 5.4% |
| Portuguese | 19.0 /100 | #208 | Poor 5.4% |
| Immigrants | Iran | 18.8 /100 | #209 | Poor 5.4% |
| Immigrants | Iraq | 18.6 /100 | #210 | Poor 5.4% |
| Iraqis | 18.1 /100 | #211 | Poor 5.4% |
| Ugandans | 18.0 /100 | #212 | Poor 5.4% |
| Immigrants | Middle Africa | 15.3 /100 | #213 | Poor 5.4% |
| Immigrants | Costa Rica | 15.2 /100 | #214 | Poor 5.4% |
| Delaware | 14.7 /100 | #215 | Poor 5.4% |
| Immigrants | South America | 13.5 /100 | #216 | Poor 5.4% |
| Immigrants | Albania | 13.5 /100 | #217 | Poor 5.4% |
| Choctaw | 12.7 /100 | #218 | Poor 5.4% |