Immigrants from Hong Kong vs Kenyan Unemployment
COMPARE
Immigrants from Hong Kong
Kenyan
Unemployment
Unemployment Comparison
Immigrants from Hong Kong
Kenyans
5.2%
UNEMPLOYMENT
75.2/ 100
METRIC RATING
152nd/ 347
METRIC RANK
5.1%
UNEMPLOYMENT
88.2/ 100
METRIC RATING
126th/ 347
METRIC RANK
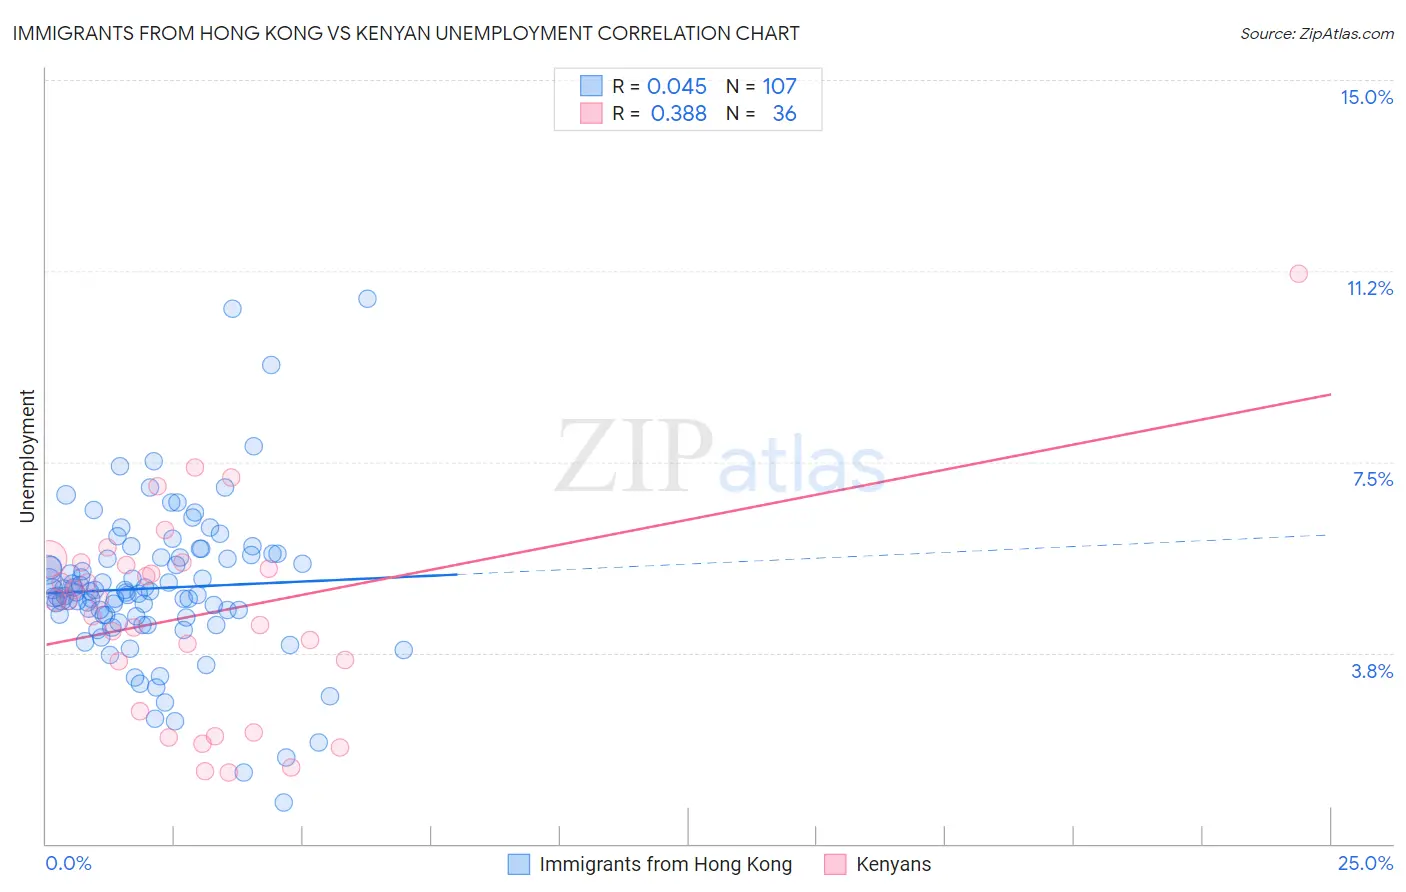
Immigrants from Hong Kong vs Kenyan Unemployment Correlation Chart
The statistical analysis conducted on geographies consisting of 253,937,877 people shows no correlation between the proportion of Immigrants from Hong Kong and unemployment in the United States with a correlation coefficient (R) of 0.045 and weighted average of 5.2%. Similarly, the statistical analysis conducted on geographies consisting of 168,184,785 people shows a mild positive correlation between the proportion of Kenyans and unemployment in the United States with a correlation coefficient (R) of 0.388 and weighted average of 5.1%, a difference of 1.4%.
Unemployment Correlation Summary
| Measurement | Immigrants from Hong Kong | Kenyan |
| Minimum | 0.80% | 1.4% |
| Maximum | 10.7% | 11.2% |
| Range | 9.9% | 9.8% |
| Mean | 5.0% | 4.5% |
| Median | 4.9% | 4.8% |
| Interquartile 25% (IQ1) | 4.4% | 3.1% |
| Interquartile 75% (IQ3) | 5.6% | 5.5% |
| Interquartile Range (IQR) | 1.2% | 2.4% |
| Standard Deviation (Sample) | 1.5% | 2.0% |
| Standard Deviation (Population) | 1.5% | 2.0% |
Similar Demographics by Unemployment
Demographics Similar to Immigrants from Hong Kong by Unemployment
In terms of unemployment, the demographic groups most similar to Immigrants from Hong Kong are Egyptian (5.2%, a difference of 0.0%), Immigrants from Eastern Europe (5.2%, a difference of 0.010%), Immigrants from China (5.2%, a difference of 0.040%), Potawatomi (5.2%, a difference of 0.080%), and Syrian (5.2%, a difference of 0.22%).
| Demographics | Rating | Rank | Unemployment |
| Immigrants | Norway | 81.8 /100 | #145 | Excellent 5.1% |
| Immigrants | Asia | 81.8 /100 | #146 | Excellent 5.1% |
| Indians (Asian) | 81.6 /100 | #147 | Excellent 5.1% |
| Immigrants | Italy | 79.1 /100 | #148 | Good 5.1% |
| Syrians | 77.7 /100 | #149 | Good 5.2% |
| Potawatomi | 76.2 /100 | #150 | Good 5.2% |
| Immigrants | Eastern Europe | 75.3 /100 | #151 | Good 5.2% |
| Immigrants | Hong Kong | 75.2 /100 | #152 | Good 5.2% |
| Egyptians | 75.2 /100 | #153 | Good 5.2% |
| Immigrants | China | 74.7 /100 | #154 | Good 5.2% |
| Immigrants | Northern Africa | 71.3 /100 | #155 | Good 5.2% |
| Immigrants | Kazakhstan | 70.4 /100 | #156 | Good 5.2% |
| Sri Lankans | 69.5 /100 | #157 | Good 5.2% |
| Immigrants | Egypt | 66.7 /100 | #158 | Good 5.2% |
| Immigrants | Russia | 66.6 /100 | #159 | Good 5.2% |
Demographics Similar to Kenyans by Unemployment
In terms of unemployment, the demographic groups most similar to Kenyans are Immigrants from Kenya (5.1%, a difference of 0.0%), Immigrants from Eastern Asia (5.1%, a difference of 0.020%), Immigrants from Eastern Africa (5.1%, a difference of 0.020%), Immigrants from Latvia (5.1%, a difference of 0.020%), and Ethiopian (5.1%, a difference of 0.070%).
| Demographics | Rating | Rank | Unemployment |
| Immigrants | France | 89.7 /100 | #119 | Excellent 5.1% |
| Macedonians | 89.7 /100 | #120 | Excellent 5.1% |
| Lebanese | 89.2 /100 | #121 | Excellent 5.1% |
| Immigrants | Switzerland | 89.1 /100 | #122 | Excellent 5.1% |
| Asians | 89.0 /100 | #123 | Excellent 5.1% |
| Ethiopians | 88.6 /100 | #124 | Excellent 5.1% |
| Immigrants | Eastern Asia | 88.3 /100 | #125 | Excellent 5.1% |
| Kenyans | 88.2 /100 | #126 | Excellent 5.1% |
| Immigrants | Kenya | 88.2 /100 | #127 | Excellent 5.1% |
| Immigrants | Eastern Africa | 88.1 /100 | #128 | Excellent 5.1% |
| Immigrants | Latvia | 88.0 /100 | #129 | Excellent 5.1% |
| Iranians | 86.9 /100 | #130 | Excellent 5.1% |
| Immigrants | Croatia | 86.8 /100 | #131 | Excellent 5.1% |
| Immigrants | Ethiopia | 86.7 /100 | #132 | Excellent 5.1% |
| Immigrants | Jordan | 86.6 /100 | #133 | Excellent 5.1% |