Immigrants from Hong Kong vs Immigrants from India Unemployment
COMPARE
Immigrants from Hong Kong
Immigrants from India
Unemployment
Unemployment Comparison
Immigrants from Hong Kong
Immigrants from India
5.2%
UNEMPLOYMENT
75.2/ 100
METRIC RATING
152nd/ 347
METRIC RANK
4.5%
UNEMPLOYMENT
100.0/ 100
METRIC RATING
7th/ 347
METRIC RANK
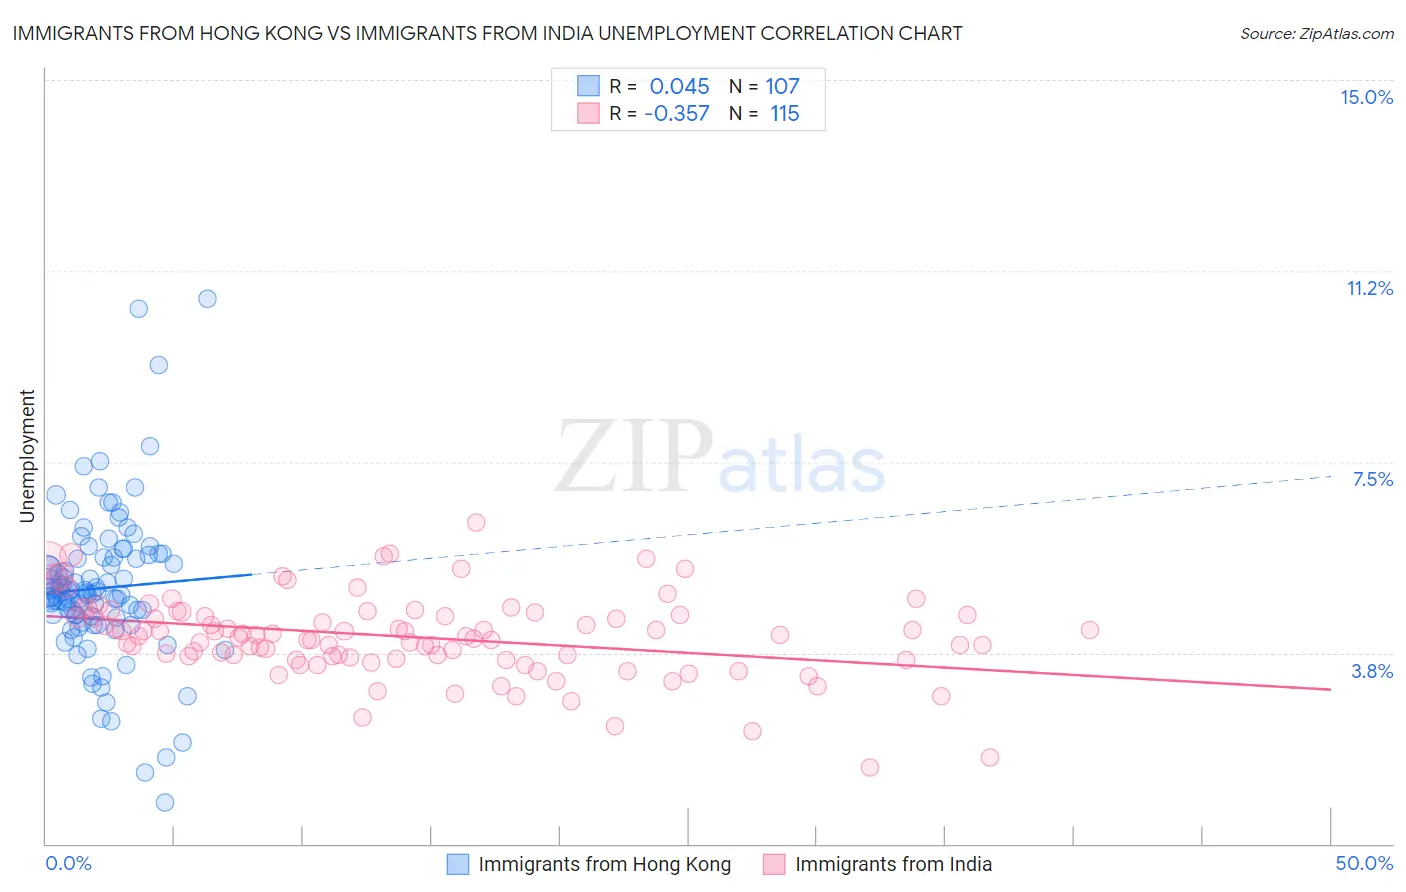
Immigrants from Hong Kong vs Immigrants from India Unemployment Correlation Chart
The statistical analysis conducted on geographies consisting of 253,937,877 people shows no correlation between the proportion of Immigrants from Hong Kong and unemployment in the United States with a correlation coefficient (R) of 0.045 and weighted average of 5.2%. Similarly, the statistical analysis conducted on geographies consisting of 433,651,365 people shows a mild negative correlation between the proportion of Immigrants from India and unemployment in the United States with a correlation coefficient (R) of -0.357 and weighted average of 4.5%, a difference of 14.6%.
Unemployment Correlation Summary
| Measurement | Immigrants from Hong Kong | Immigrants from India |
| Minimum | 0.80% | 1.5% |
| Maximum | 10.7% | 6.3% |
| Range | 9.9% | 4.8% |
| Mean | 5.0% | 4.1% |
| Median | 4.9% | 4.1% |
| Interquartile 25% (IQ1) | 4.4% | 3.6% |
| Interquartile 75% (IQ3) | 5.6% | 4.5% |
| Interquartile Range (IQR) | 1.2% | 0.85% |
| Standard Deviation (Sample) | 1.5% | 0.80% |
| Standard Deviation (Population) | 1.5% | 0.80% |
Similar Demographics by Unemployment
Demographics Similar to Immigrants from Hong Kong by Unemployment
In terms of unemployment, the demographic groups most similar to Immigrants from Hong Kong are Egyptian (5.2%, a difference of 0.0%), Immigrants from Eastern Europe (5.2%, a difference of 0.010%), Immigrants from China (5.2%, a difference of 0.040%), Potawatomi (5.2%, a difference of 0.080%), and Syrian (5.2%, a difference of 0.22%).
| Demographics | Rating | Rank | Unemployment |
| Immigrants | Norway | 81.8 /100 | #145 | Excellent 5.1% |
| Immigrants | Asia | 81.8 /100 | #146 | Excellent 5.1% |
| Indians (Asian) | 81.6 /100 | #147 | Excellent 5.1% |
| Immigrants | Italy | 79.1 /100 | #148 | Good 5.1% |
| Syrians | 77.7 /100 | #149 | Good 5.2% |
| Potawatomi | 76.2 /100 | #150 | Good 5.2% |
| Immigrants | Eastern Europe | 75.3 /100 | #151 | Good 5.2% |
| Immigrants | Hong Kong | 75.2 /100 | #152 | Good 5.2% |
| Egyptians | 75.2 /100 | #153 | Good 5.2% |
| Immigrants | China | 74.7 /100 | #154 | Good 5.2% |
| Immigrants | Northern Africa | 71.3 /100 | #155 | Good 5.2% |
| Immigrants | Kazakhstan | 70.4 /100 | #156 | Good 5.2% |
| Sri Lankans | 69.5 /100 | #157 | Good 5.2% |
| Immigrants | Egypt | 66.7 /100 | #158 | Good 5.2% |
| Immigrants | Russia | 66.6 /100 | #159 | Good 5.2% |
Demographics Similar to Immigrants from India by Unemployment
In terms of unemployment, the demographic groups most similar to Immigrants from India are Swiss (4.5%, a difference of 0.46%), German (4.5%, a difference of 0.55%), Scandinavian (4.5%, a difference of 0.86%), Swedish (4.4%, a difference of 1.3%), and Dutch (4.6%, a difference of 1.4%).
| Demographics | Rating | Rank | Unemployment |
| Norwegians | 100.0 /100 | #1 | Exceptional 4.2% |
| Luxembourgers | 100.0 /100 | #2 | Exceptional 4.3% |
| Czechs | 100.0 /100 | #3 | Exceptional 4.3% |
| Danes | 100.0 /100 | #4 | Exceptional 4.3% |
| Swedes | 100.0 /100 | #5 | Exceptional 4.4% |
| Germans | 100.0 /100 | #6 | Exceptional 4.5% |
| Immigrants | India | 100.0 /100 | #7 | Exceptional 4.5% |
| Swiss | 100.0 /100 | #8 | Exceptional 4.5% |
| Scandinavians | 100.0 /100 | #9 | Exceptional 4.5% |
| Dutch | 100.0 /100 | #10 | Exceptional 4.6% |
| English | 100.0 /100 | #11 | Exceptional 4.6% |
| Pennsylvania Germans | 100.0 /100 | #12 | Exceptional 4.6% |
| Belgians | 100.0 /100 | #13 | Exceptional 4.6% |
| Immigrants | Cuba | 100.0 /100 | #14 | Exceptional 4.6% |
| Europeans | 99.9 /100 | #15 | Exceptional 4.6% |