Immigrants from Hong Kong vs Immigrants from Ukraine 2nd Grade
COMPARE
Immigrants from Hong Kong
Immigrants from Ukraine
2nd Grade
2nd Grade Comparison
Immigrants from Hong Kong
Immigrants from Ukraine
97.2%
2ND GRADE
0.0/ 100
METRIC RATING
285th/ 347
METRIC RANK
97.8%
2ND GRADE
20.5/ 100
METRIC RATING
202nd/ 347
METRIC RANK
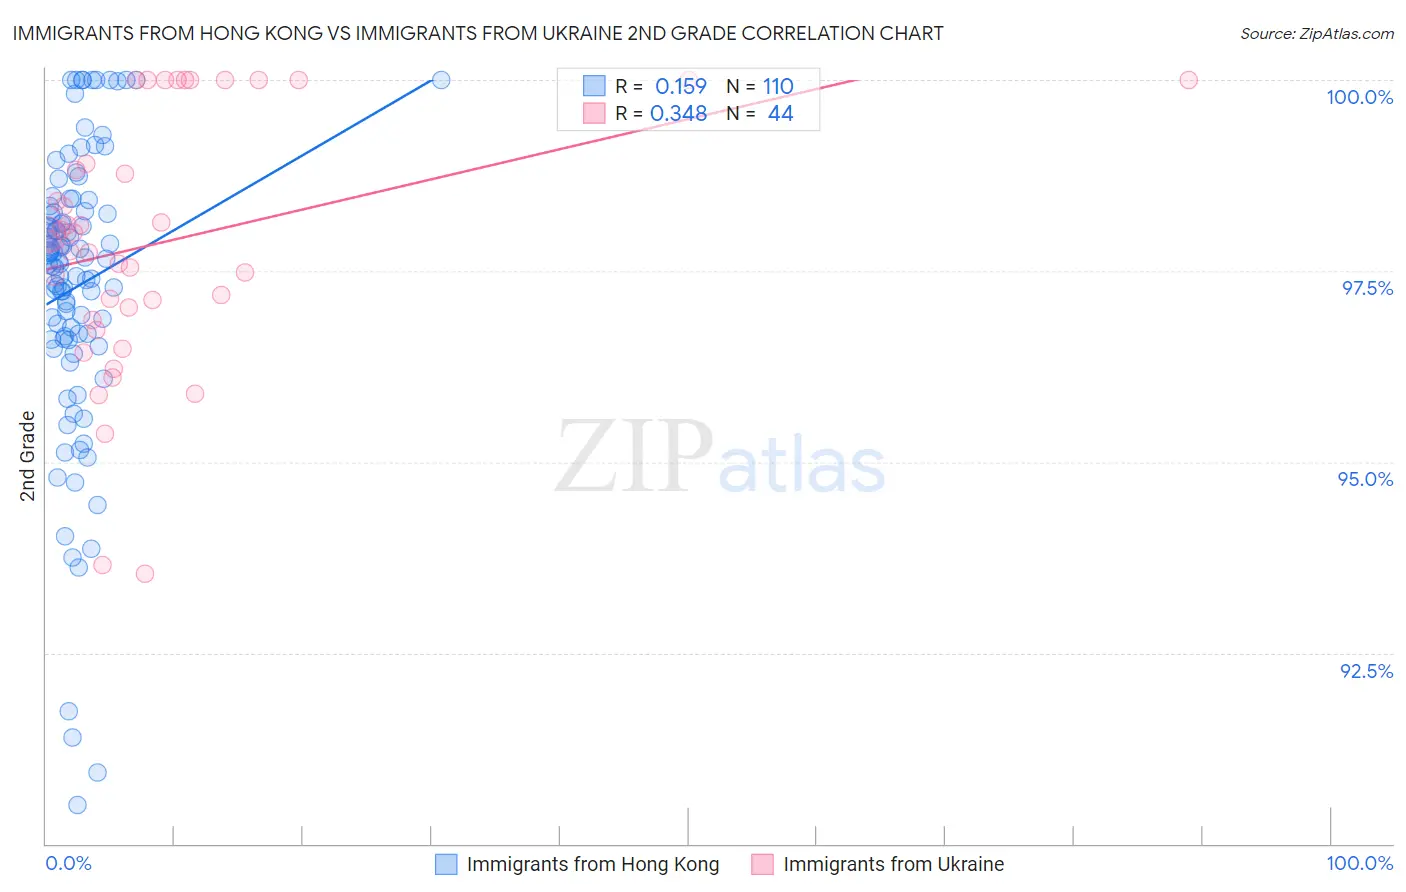
Immigrants from Hong Kong vs Immigrants from Ukraine 2nd Grade Correlation Chart
The statistical analysis conducted on geographies consisting of 253,948,669 people shows a poor positive correlation between the proportion of Immigrants from Hong Kong and percentage of population with at least 2nd grade education in the United States with a correlation coefficient (R) of 0.159 and weighted average of 97.2%. Similarly, the statistical analysis conducted on geographies consisting of 289,712,791 people shows a mild positive correlation between the proportion of Immigrants from Ukraine and percentage of population with at least 2nd grade education in the United States with a correlation coefficient (R) of 0.348 and weighted average of 97.8%, a difference of 0.55%.
2nd Grade Correlation Summary
| Measurement | Immigrants from Hong Kong | Immigrants from Ukraine |
| Minimum | 90.5% | 93.5% |
| Maximum | 100.0% | 100.0% |
| Range | 9.5% | 6.5% |
| Mean | 97.3% | 97.9% |
| Median | 97.6% | 97.9% |
| Interquartile 25% (IQ1) | 96.6% | 96.9% |
| Interquartile 75% (IQ3) | 98.3% | 99.4% |
| Interquartile Range (IQR) | 1.7% | 2.5% |
| Standard Deviation (Sample) | 1.9% | 1.7% |
| Standard Deviation (Population) | 1.9% | 1.6% |
Similar Demographics by 2nd Grade
Demographics Similar to Immigrants from Hong Kong by 2nd Grade
In terms of 2nd grade, the demographic groups most similar to Immigrants from Hong Kong are Immigrants from Barbados (97.2%, a difference of 0.0%), Immigrants from Portugal (97.2%, a difference of 0.0%), Immigrants from West Indies (97.2%, a difference of 0.010%), Immigrants from Thailand (97.2%, a difference of 0.010%), and Immigrants from Trinidad and Tobago (97.2%, a difference of 0.020%).
| Demographics | Rating | Rank | 2nd Grade |
| Immigrants | Uzbekistan | 0.1 /100 | #278 | Tragic 97.3% |
| Immigrants | Ghana | 0.1 /100 | #279 | Tragic 97.3% |
| Afghans | 0.1 /100 | #280 | Tragic 97.3% |
| Trinidadians and Tobagonians | 0.1 /100 | #281 | Tragic 97.3% |
| Barbadians | 0.1 /100 | #282 | Tragic 97.3% |
| Immigrants | Trinidad and Tobago | 0.0 /100 | #283 | Tragic 97.2% |
| Immigrants | West Indies | 0.0 /100 | #284 | Tragic 97.2% |
| Immigrants | Hong Kong | 0.0 /100 | #285 | Tragic 97.2% |
| Immigrants | Barbados | 0.0 /100 | #286 | Tragic 97.2% |
| Immigrants | Portugal | 0.0 /100 | #287 | Tragic 97.2% |
| Immigrants | Thailand | 0.0 /100 | #288 | Tragic 97.2% |
| Houma | 0.0 /100 | #289 | Tragic 97.2% |
| Immigrants | St. Vincent and the Grenadines | 0.0 /100 | #290 | Tragic 97.2% |
| Immigrants | Afghanistan | 0.0 /100 | #291 | Tragic 97.2% |
| Immigrants | Eritrea | 0.0 /100 | #292 | Tragic 97.2% |
Demographics Similar to Immigrants from Ukraine by 2nd Grade
In terms of 2nd grade, the demographic groups most similar to Immigrants from Ukraine are Immigrants from Lebanon (97.8%, a difference of 0.0%), Tohono O'odham (97.8%, a difference of 0.0%), Yuman (97.8%, a difference of 0.0%), Immigrants from Albania (97.8%, a difference of 0.010%), and Immigrants from Southern Europe (97.8%, a difference of 0.010%).
| Demographics | Rating | Rank | 2nd Grade |
| Mongolians | 26.7 /100 | #195 | Fair 97.8% |
| Immigrants | Kenya | 26.4 /100 | #196 | Fair 97.8% |
| Immigrants | Uganda | 26.3 /100 | #197 | Fair 97.8% |
| Guamanians/Chamorros | 25.7 /100 | #198 | Fair 97.8% |
| Immigrants | Egypt | 24.4 /100 | #199 | Fair 97.8% |
| Immigrants | Lebanon | 20.9 /100 | #200 | Fair 97.8% |
| Tohono O'odham | 20.9 /100 | #201 | Fair 97.8% |
| Immigrants | Ukraine | 20.5 /100 | #202 | Fair 97.8% |
| Yuman | 20.0 /100 | #203 | Fair 97.8% |
| Immigrants | Albania | 18.4 /100 | #204 | Poor 97.8% |
| Immigrants | Southern Europe | 18.1 /100 | #205 | Poor 97.8% |
| Immigrants | Chile | 17.3 /100 | #206 | Poor 97.7% |
| Africans | 15.6 /100 | #207 | Poor 97.7% |
| Immigrants | Northern Africa | 12.3 /100 | #208 | Poor 97.7% |
| Immigrants | Oceania | 10.9 /100 | #209 | Poor 97.7% |