Immigrants from Honduras vs Slovene Female Unemployment
COMPARE
Immigrants from Honduras
Slovene
Female Unemployment
Female Unemployment Comparison
Immigrants from Honduras
Slovenes
5.9%
FEMALE UNEMPLOYMENT
0.0/ 100
METRIC RATING
270th/ 347
METRIC RANK
4.5%
FEMALE UNEMPLOYMENT
100.0/ 100
METRIC RATING
9th/ 347
METRIC RANK
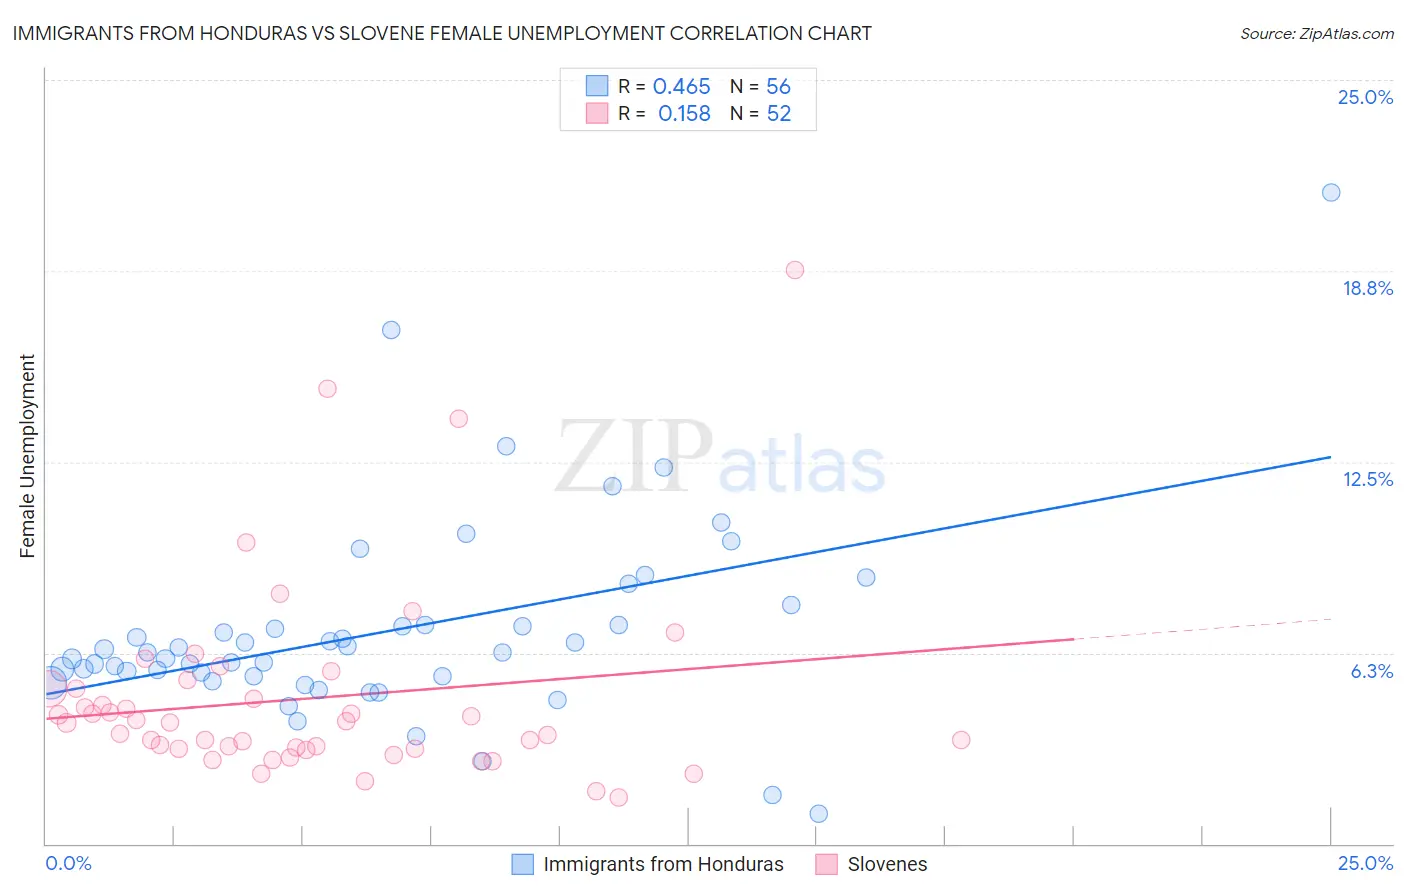
Immigrants from Honduras vs Slovene Female Unemployment Correlation Chart
The statistical analysis conducted on geographies consisting of 321,601,293 people shows a moderate positive correlation between the proportion of Immigrants from Honduras and unemploymnet rate among females in the United States with a correlation coefficient (R) of 0.465 and weighted average of 5.9%. Similarly, the statistical analysis conducted on geographies consisting of 260,209,646 people shows a poor positive correlation between the proportion of Slovenes and unemploymnet rate among females in the United States with a correlation coefficient (R) of 0.158 and weighted average of 4.5%, a difference of 31.7%.
Female Unemployment Correlation Summary
| Measurement | Immigrants from Honduras | Slovene |
| Minimum | 1.0% | 1.5% |
| Maximum | 21.3% | 18.8% |
| Range | 20.3% | 17.3% |
| Mean | 7.0% | 4.8% |
| Median | 6.3% | 4.0% |
| Interquartile 25% (IQ1) | 5.5% | 3.1% |
| Interquartile 75% (IQ3) | 7.1% | 5.1% |
| Interquartile Range (IQR) | 1.6% | 2.0% |
| Standard Deviation (Sample) | 3.3% | 3.2% |
| Standard Deviation (Population) | 3.3% | 3.2% |
Similar Demographics by Female Unemployment
Demographics Similar to Immigrants from Honduras by Female Unemployment
In terms of female unemployment, the demographic groups most similar to Immigrants from Honduras are Central American (5.9%, a difference of 0.10%), Lumbee (5.9%, a difference of 0.29%), Ghanaian (5.9%, a difference of 0.30%), African (5.9%, a difference of 0.38%), and Immigrants from Western Africa (5.9%, a difference of 0.41%).
| Demographics | Rating | Rank | Female Unemployment |
| Immigrants | Azores | 0.1 /100 | #263 | Tragic 5.8% |
| Immigrants | Bahamas | 0.1 /100 | #264 | Tragic 5.8% |
| Blackfeet | 0.0 /100 | #265 | Tragic 5.9% |
| Cape Verdeans | 0.0 /100 | #266 | Tragic 5.9% |
| Nepalese | 0.0 /100 | #267 | Tragic 5.9% |
| Hondurans | 0.0 /100 | #268 | Tragic 5.9% |
| Immigrants | Western Africa | 0.0 /100 | #269 | Tragic 5.9% |
| Immigrants | Honduras | 0.0 /100 | #270 | Tragic 5.9% |
| Central Americans | 0.0 /100 | #271 | Tragic 5.9% |
| Lumbee | 0.0 /100 | #272 | Tragic 5.9% |
| Ghanaians | 0.0 /100 | #273 | Tragic 5.9% |
| Africans | 0.0 /100 | #274 | Tragic 5.9% |
| Senegalese | 0.0 /100 | #275 | Tragic 6.0% |
| Bahamians | 0.0 /100 | #276 | Tragic 6.0% |
| Immigrants | Ghana | 0.0 /100 | #277 | Tragic 6.0% |
Demographics Similar to Slovenes by Female Unemployment
In terms of female unemployment, the demographic groups most similar to Slovenes are German (4.5%, a difference of 0.36%), Chinese (4.5%, a difference of 0.38%), Swedish (4.4%, a difference of 1.1%), Swiss (4.6%, a difference of 1.3%), and Scandinavian (4.6%, a difference of 1.4%).
| Demographics | Rating | Rank | Female Unemployment |
| Czechs | 100.0 /100 | #2 | Exceptional 4.4% |
| Luxembourgers | 100.0 /100 | #3 | Exceptional 4.4% |
| Danes | 100.0 /100 | #4 | Exceptional 4.4% |
| Hmong | 100.0 /100 | #5 | Exceptional 4.4% |
| Swedes | 100.0 /100 | #6 | Exceptional 4.4% |
| Chinese | 100.0 /100 | #7 | Exceptional 4.5% |
| Germans | 100.0 /100 | #8 | Exceptional 4.5% |
| Slovenes | 100.0 /100 | #9 | Exceptional 4.5% |
| Swiss | 100.0 /100 | #10 | Exceptional 4.6% |
| Scandinavians | 100.0 /100 | #11 | Exceptional 4.6% |
| Dutch | 100.0 /100 | #12 | Exceptional 4.6% |
| Belgians | 100.0 /100 | #13 | Exceptional 4.6% |
| Finns | 100.0 /100 | #14 | Exceptional 4.6% |
| English | 100.0 /100 | #15 | Exceptional 4.6% |
| Carpatho Rusyns | 99.9 /100 | #16 | Exceptional 4.7% |