Immigrants from Honduras vs Immigrants from Belarus Female Unemployment
COMPARE
Immigrants from Honduras
Immigrants from Belarus
Female Unemployment
Female Unemployment Comparison
Immigrants from Honduras
Immigrants from Belarus
5.9%
FEMALE UNEMPLOYMENT
0.0/ 100
METRIC RATING
270th/ 347
METRIC RANK
5.3%
FEMALE UNEMPLOYMENT
39.4/ 100
METRIC RATING
186th/ 347
METRIC RANK
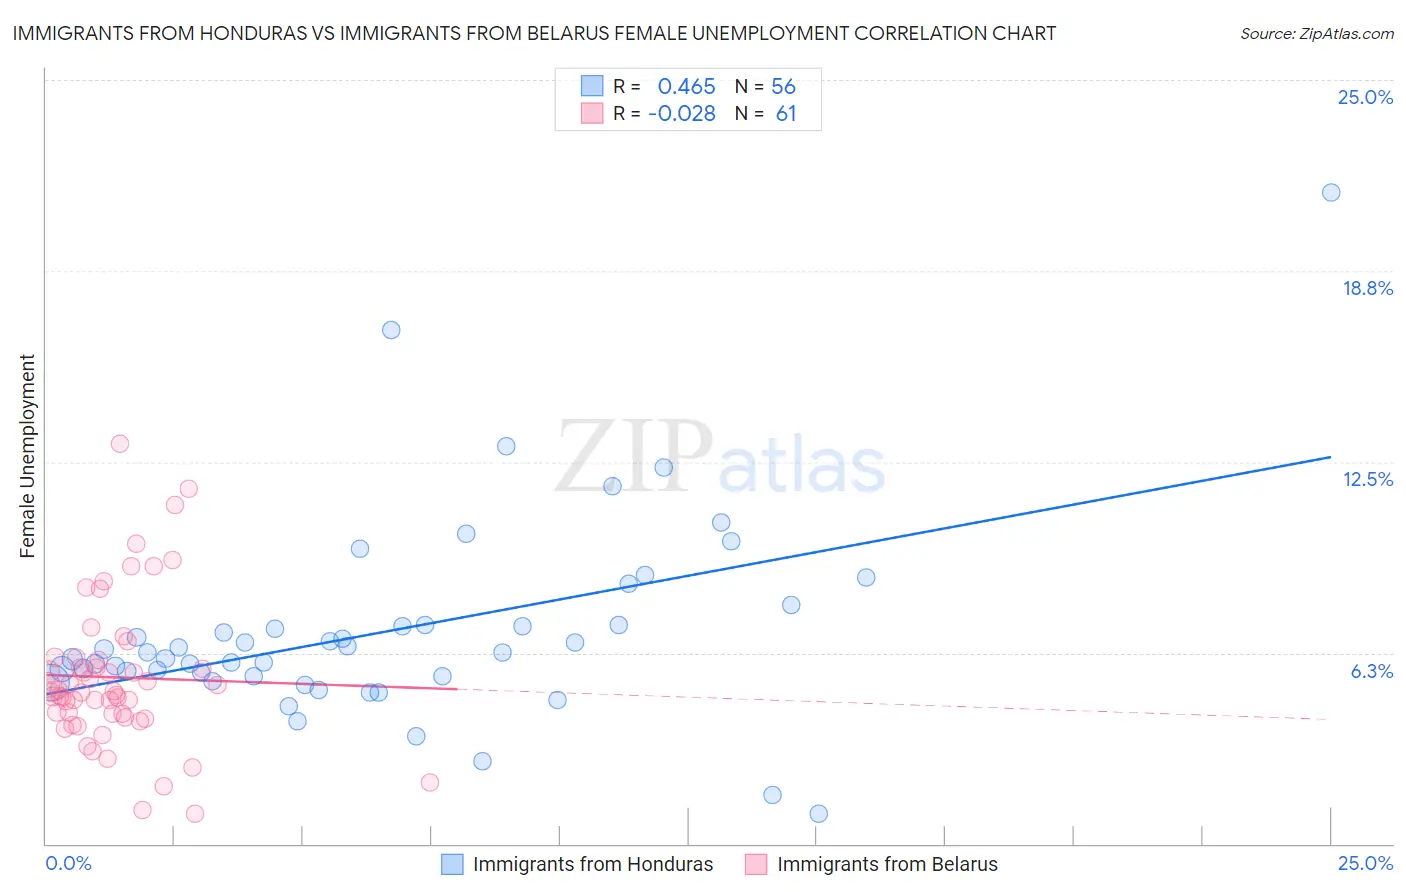
Immigrants from Honduras vs Immigrants from Belarus Female Unemployment Correlation Chart
The statistical analysis conducted on geographies consisting of 321,601,293 people shows a moderate positive correlation between the proportion of Immigrants from Honduras and unemploymnet rate among females in the United States with a correlation coefficient (R) of 0.465 and weighted average of 5.9%. Similarly, the statistical analysis conducted on geographies consisting of 150,026,552 people shows no correlation between the proportion of Immigrants from Belarus and unemploymnet rate among females in the United States with a correlation coefficient (R) of -0.028 and weighted average of 5.3%, a difference of 12.0%.
Female Unemployment Correlation Summary
| Measurement | Immigrants from Honduras | Immigrants from Belarus |
| Minimum | 1.0% | 1.0% |
| Maximum | 21.3% | 13.1% |
| Range | 20.3% | 12.1% |
| Mean | 7.0% | 5.4% |
| Median | 6.3% | 5.0% |
| Interquartile 25% (IQ1) | 5.5% | 4.2% |
| Interquartile 75% (IQ3) | 7.1% | 6.0% |
| Interquartile Range (IQR) | 1.6% | 1.9% |
| Standard Deviation (Sample) | 3.3% | 2.4% |
| Standard Deviation (Population) | 3.3% | 2.4% |
Similar Demographics by Female Unemployment
Demographics Similar to Immigrants from Honduras by Female Unemployment
In terms of female unemployment, the demographic groups most similar to Immigrants from Honduras are Central American (5.9%, a difference of 0.10%), Lumbee (5.9%, a difference of 0.29%), Ghanaian (5.9%, a difference of 0.30%), African (5.9%, a difference of 0.38%), and Immigrants from Western Africa (5.9%, a difference of 0.41%).
| Demographics | Rating | Rank | Female Unemployment |
| Immigrants | Azores | 0.1 /100 | #263 | Tragic 5.8% |
| Immigrants | Bahamas | 0.1 /100 | #264 | Tragic 5.8% |
| Blackfeet | 0.0 /100 | #265 | Tragic 5.9% |
| Cape Verdeans | 0.0 /100 | #266 | Tragic 5.9% |
| Nepalese | 0.0 /100 | #267 | Tragic 5.9% |
| Hondurans | 0.0 /100 | #268 | Tragic 5.9% |
| Immigrants | Western Africa | 0.0 /100 | #269 | Tragic 5.9% |
| Immigrants | Honduras | 0.0 /100 | #270 | Tragic 5.9% |
| Central Americans | 0.0 /100 | #271 | Tragic 5.9% |
| Lumbee | 0.0 /100 | #272 | Tragic 5.9% |
| Ghanaians | 0.0 /100 | #273 | Tragic 5.9% |
| Africans | 0.0 /100 | #274 | Tragic 5.9% |
| Senegalese | 0.0 /100 | #275 | Tragic 6.0% |
| Bahamians | 0.0 /100 | #276 | Tragic 6.0% |
| Immigrants | Ghana | 0.0 /100 | #277 | Tragic 6.0% |
Demographics Similar to Immigrants from Belarus by Female Unemployment
In terms of female unemployment, the demographic groups most similar to Immigrants from Belarus are Malaysian (5.3%, a difference of 0.040%), Immigrants from Ukraine (5.3%, a difference of 0.050%), Immigrants from Indonesia (5.3%, a difference of 0.080%), Taiwanese (5.3%, a difference of 0.20%), and Nonimmigrants (5.3%, a difference of 0.20%).
| Demographics | Rating | Rank | Female Unemployment |
| Laotians | 45.1 /100 | #179 | Average 5.3% |
| Immigrants | Congo | 43.1 /100 | #180 | Average 5.3% |
| Taiwanese | 42.7 /100 | #181 | Average 5.3% |
| Immigrants | Nonimmigrants | 42.6 /100 | #182 | Average 5.3% |
| Immigrants | Indonesia | 40.7 /100 | #183 | Average 5.3% |
| Immigrants | Ukraine | 40.1 /100 | #184 | Average 5.3% |
| Malaysians | 40.1 /100 | #185 | Average 5.3% |
| Immigrants | Belarus | 39.4 /100 | #186 | Fair 5.3% |
| Immigrants | Albania | 35.4 /100 | #187 | Fair 5.3% |
| Afghans | 33.9 /100 | #188 | Fair 5.3% |
| Costa Ricans | 33.8 /100 | #189 | Fair 5.3% |
| Ugandans | 31.2 /100 | #190 | Fair 5.3% |
| Cherokee | 30.8 /100 | #191 | Fair 5.3% |
| Portuguese | 28.6 /100 | #192 | Fair 5.3% |
| Arabs | 27.7 /100 | #193 | Fair 5.3% |