Slavic vs Yuman Unemployment Among Ages 25 to 29 years
COMPARE
Slavic
Yuman
Unemployment Among Ages 25 to 29 years
Unemployment Among Ages 25 to 29 years Comparison
Slavs
Yuman
6.5%
UNEMPLOYMENT AMONG AGES 25 TO 29 YEARS
72.5/ 100
METRIC RATING
142nd/ 347
METRIC RANK
11.0%
UNEMPLOYMENT AMONG AGES 25 TO 29 YEARS
0.0/ 100
METRIC RATING
334th/ 347
METRIC RANK
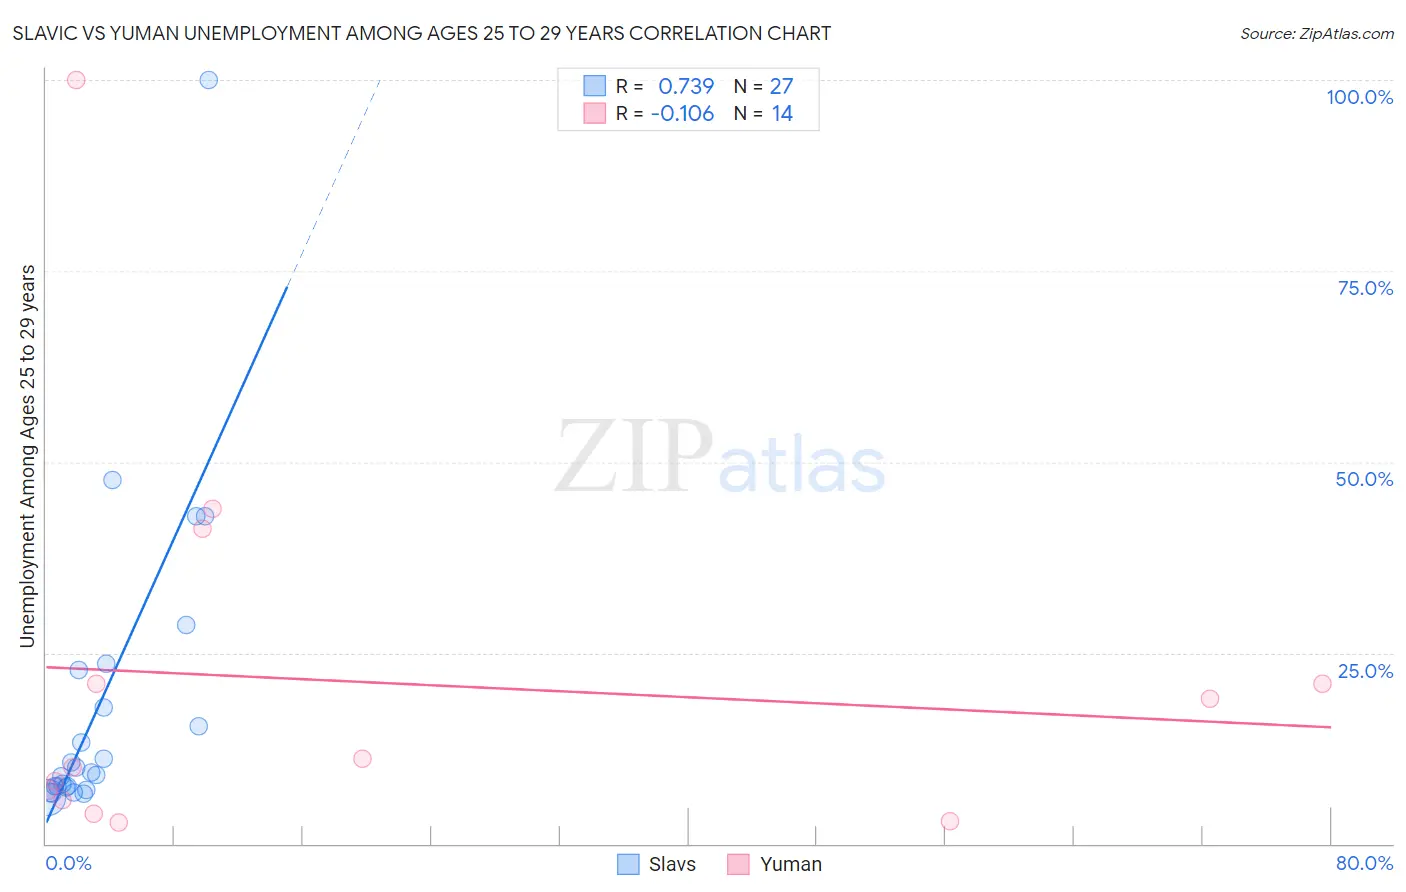
Slavic vs Yuman Unemployment Among Ages 25 to 29 years Correlation Chart
The statistical analysis conducted on geographies consisting of 259,335,630 people shows a strong positive correlation between the proportion of Slavs and unemployment rate among population between the ages 25 and 29 in the United States with a correlation coefficient (R) of 0.739 and weighted average of 6.5%. Similarly, the statistical analysis conducted on geographies consisting of 40,399,570 people shows a poor negative correlation between the proportion of Yuman and unemployment rate among population between the ages 25 and 29 in the United States with a correlation coefficient (R) of -0.106 and weighted average of 11.0%, a difference of 68.0%.
Unemployment Among Ages 25 to 29 years Correlation Summary
| Measurement | Slavic | Yuman |
| Minimum | 6.1% | 2.8% |
| Maximum | 100.0% | 100.0% |
| Range | 93.9% | 97.2% |
| Mean | 18.2% | 21.3% |
| Median | 9.4% | 10.5% |
| Interquartile 25% (IQ1) | 7.4% | 5.8% |
| Interquartile 75% (IQ3) | 22.8% | 21.0% |
| Interquartile Range (IQR) | 15.4% | 15.2% |
| Standard Deviation (Sample) | 20.3% | 26.2% |
| Standard Deviation (Population) | 20.0% | 25.3% |
Similar Demographics by Unemployment Among Ages 25 to 29 years
Demographics Similar to Slavs by Unemployment Among Ages 25 to 29 years
In terms of unemployment among ages 25 to 29 years, the demographic groups most similar to Slavs are Lithuanian (6.5%, a difference of 0.020%), Maltese (6.5%, a difference of 0.030%), Immigrants from Micronesia (6.6%, a difference of 0.080%), Immigrants from Belgium (6.5%, a difference of 0.10%), and Austrian (6.5%, a difference of 0.10%).
| Demographics | Rating | Rank | Unemployment Among Ages 25 to 29 years |
| Immigrants | Croatia | 75.5 /100 | #135 | Good 6.5% |
| Northern Europeans | 75.4 /100 | #136 | Good 6.5% |
| Eastern Europeans | 74.1 /100 | #137 | Good 6.5% |
| Immigrants | Belgium | 73.8 /100 | #138 | Good 6.5% |
| Austrians | 73.8 /100 | #139 | Good 6.5% |
| Immigrants | Pakistan | 73.8 /100 | #140 | Good 6.5% |
| Maltese | 72.9 /100 | #141 | Good 6.5% |
| Slavs | 72.5 /100 | #142 | Good 6.5% |
| Lithuanians | 72.2 /100 | #143 | Good 6.5% |
| Immigrants | Micronesia | 71.5 /100 | #144 | Good 6.6% |
| Nicaraguans | 70.2 /100 | #145 | Good 6.6% |
| Romanians | 69.5 /100 | #146 | Good 6.6% |
| Immigrants | Thailand | 68.4 /100 | #147 | Good 6.6% |
| Peruvians | 68.1 /100 | #148 | Good 6.6% |
| Malaysians | 67.1 /100 | #149 | Good 6.6% |
Demographics Similar to Yuman by Unemployment Among Ages 25 to 29 years
In terms of unemployment among ages 25 to 29 years, the demographic groups most similar to Yuman are Puerto Rican (11.1%, a difference of 1.1%), Alaskan Athabascan (10.8%, a difference of 2.0%), Lumbee (11.2%, a difference of 2.2%), Menominee (11.3%, a difference of 2.5%), and Pueblo (10.4%, a difference of 5.4%).
| Demographics | Rating | Rank | Unemployment Among Ages 25 to 29 years |
| Colville | 0.0 /100 | #327 | Tragic 9.2% |
| Apache | 0.0 /100 | #328 | Tragic 9.5% |
| Aleuts | 0.0 /100 | #329 | Tragic 9.7% |
| Natives/Alaskans | 0.0 /100 | #330 | Tragic 9.8% |
| Alaska Natives | 0.0 /100 | #331 | Tragic 10.2% |
| Pueblo | 0.0 /100 | #332 | Tragic 10.4% |
| Alaskan Athabascans | 0.0 /100 | #333 | Tragic 10.8% |
| Yuman | 0.0 /100 | #334 | Tragic 11.0% |
| Puerto Ricans | 0.0 /100 | #335 | Tragic 11.1% |
| Lumbee | 0.0 /100 | #336 | Tragic 11.2% |
| Menominee | 0.0 /100 | #337 | Tragic 11.3% |
| Sioux | 0.0 /100 | #338 | Tragic 11.7% |
| Pima | 0.0 /100 | #339 | Tragic 11.8% |
| Cheyenne | 0.0 /100 | #340 | Tragic 11.8% |
| Tohono O'odham | 0.0 /100 | #341 | Tragic 12.1% |