Immigrants from Northern Europe vs Yuman Unemployment Among Ages 25 to 29 years
COMPARE
Immigrants from Northern Europe
Yuman
Unemployment Among Ages 25 to 29 years
Unemployment Among Ages 25 to 29 years Comparison
Immigrants from Northern Europe
Yuman
6.6%
UNEMPLOYMENT AMONG AGES 25 TO 29 YEARS
57.3/ 100
METRIC RATING
166th/ 347
METRIC RANK
11.0%
UNEMPLOYMENT AMONG AGES 25 TO 29 YEARS
0.0/ 100
METRIC RATING
334th/ 347
METRIC RANK
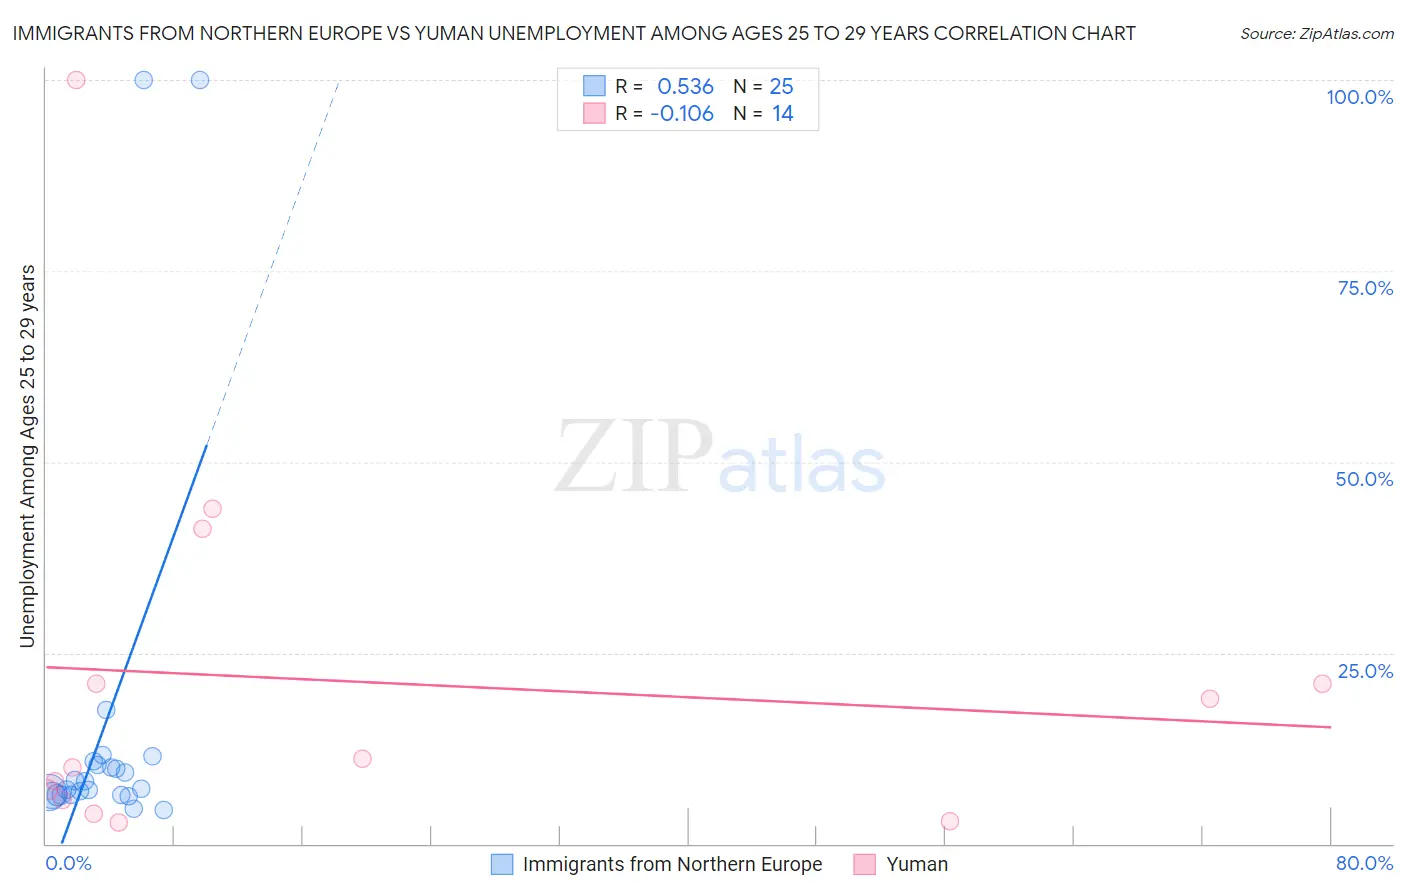
Immigrants from Northern Europe vs Yuman Unemployment Among Ages 25 to 29 years Correlation Chart
The statistical analysis conducted on geographies consisting of 443,526,029 people shows a substantial positive correlation between the proportion of Immigrants from Northern Europe and unemployment rate among population between the ages 25 and 29 in the United States with a correlation coefficient (R) of 0.536 and weighted average of 6.6%. Similarly, the statistical analysis conducted on geographies consisting of 40,399,570 people shows a poor negative correlation between the proportion of Yuman and unemployment rate among population between the ages 25 and 29 in the United States with a correlation coefficient (R) of -0.106 and weighted average of 11.0%, a difference of 66.2%.
Unemployment Among Ages 25 to 29 years Correlation Summary
| Measurement | Immigrants from Northern Europe | Yuman |
| Minimum | 4.5% | 2.8% |
| Maximum | 100.0% | 100.0% |
| Range | 95.5% | 97.2% |
| Mean | 15.6% | 21.3% |
| Median | 7.2% | 10.5% |
| Interquartile 25% (IQ1) | 6.4% | 5.8% |
| Interquartile 75% (IQ3) | 10.6% | 21.0% |
| Interquartile Range (IQR) | 4.3% | 15.2% |
| Standard Deviation (Sample) | 25.6% | 26.2% |
| Standard Deviation (Population) | 25.0% | 25.3% |
Similar Demographics by Unemployment Among Ages 25 to 29 years
Demographics Similar to Immigrants from Northern Europe by Unemployment Among Ages 25 to 29 years
In terms of unemployment among ages 25 to 29 years, the demographic groups most similar to Immigrants from Northern Europe are English (6.6%, a difference of 0.040%), Greek (6.6%, a difference of 0.070%), Immigrants from Middle Africa (6.6%, a difference of 0.13%), Immigrants from Canada (6.6%, a difference of 0.14%), and Estonian (6.6%, a difference of 0.16%).
| Demographics | Rating | Rank | Unemployment Among Ages 25 to 29 years |
| Welsh | 61.3 /100 | #159 | Good 6.6% |
| Scottish | 60.7 /100 | #160 | Good 6.6% |
| Paraguayans | 60.4 /100 | #161 | Good 6.6% |
| Immigrants | Czechoslovakia | 60.2 /100 | #162 | Good 6.6% |
| Immigrants | Middle Africa | 59.4 /100 | #163 | Average 6.6% |
| Greeks | 58.5 /100 | #164 | Average 6.6% |
| English | 58.0 /100 | #165 | Average 6.6% |
| Immigrants | Northern Europe | 57.3 /100 | #166 | Average 6.6% |
| Immigrants | Canada | 55.0 /100 | #167 | Average 6.6% |
| Estonians | 54.8 /100 | #168 | Average 6.6% |
| South Americans | 54.5 /100 | #169 | Average 6.6% |
| Albanians | 53.5 /100 | #170 | Average 6.6% |
| Immigrants | Cambodia | 52.6 /100 | #171 | Average 6.6% |
| Bangladeshis | 51.6 /100 | #172 | Average 6.6% |
| Russians | 51.3 /100 | #173 | Average 6.6% |
Demographics Similar to Yuman by Unemployment Among Ages 25 to 29 years
In terms of unemployment among ages 25 to 29 years, the demographic groups most similar to Yuman are Puerto Rican (11.1%, a difference of 1.1%), Alaskan Athabascan (10.8%, a difference of 2.0%), Lumbee (11.2%, a difference of 2.2%), Menominee (11.3%, a difference of 2.5%), and Pueblo (10.4%, a difference of 5.4%).
| Demographics | Rating | Rank | Unemployment Among Ages 25 to 29 years |
| Colville | 0.0 /100 | #327 | Tragic 9.2% |
| Apache | 0.0 /100 | #328 | Tragic 9.5% |
| Aleuts | 0.0 /100 | #329 | Tragic 9.7% |
| Natives/Alaskans | 0.0 /100 | #330 | Tragic 9.8% |
| Alaska Natives | 0.0 /100 | #331 | Tragic 10.2% |
| Pueblo | 0.0 /100 | #332 | Tragic 10.4% |
| Alaskan Athabascans | 0.0 /100 | #333 | Tragic 10.8% |
| Yuman | 0.0 /100 | #334 | Tragic 11.0% |
| Puerto Ricans | 0.0 /100 | #335 | Tragic 11.1% |
| Lumbee | 0.0 /100 | #336 | Tragic 11.2% |
| Menominee | 0.0 /100 | #337 | Tragic 11.3% |
| Sioux | 0.0 /100 | #338 | Tragic 11.7% |
| Pima | 0.0 /100 | #339 | Tragic 11.8% |
| Cheyenne | 0.0 /100 | #340 | Tragic 11.8% |
| Tohono O'odham | 0.0 /100 | #341 | Tragic 12.1% |