Immigrants from Guyana vs Immigrants from Zaire Unemployment Among Women with Children Under 6 years
COMPARE
Immigrants from Guyana
Immigrants from Zaire
Unemployment Among Women with Children Under 6 years
Unemployment Among Women with Children Under 6 years Comparison
Immigrants from Guyana
Immigrants from Zaire
8.2%
UNEMPLOYMENT AMONG WOMEN WITH CHILDREN UNDER 6 YEARS
0.8/ 100
METRIC RATING
253rd/ 347
METRIC RANK
7.3%
UNEMPLOYMENT AMONG WOMEN WITH CHILDREN UNDER 6 YEARS
93.3/ 100
METRIC RATING
123rd/ 347
METRIC RANK
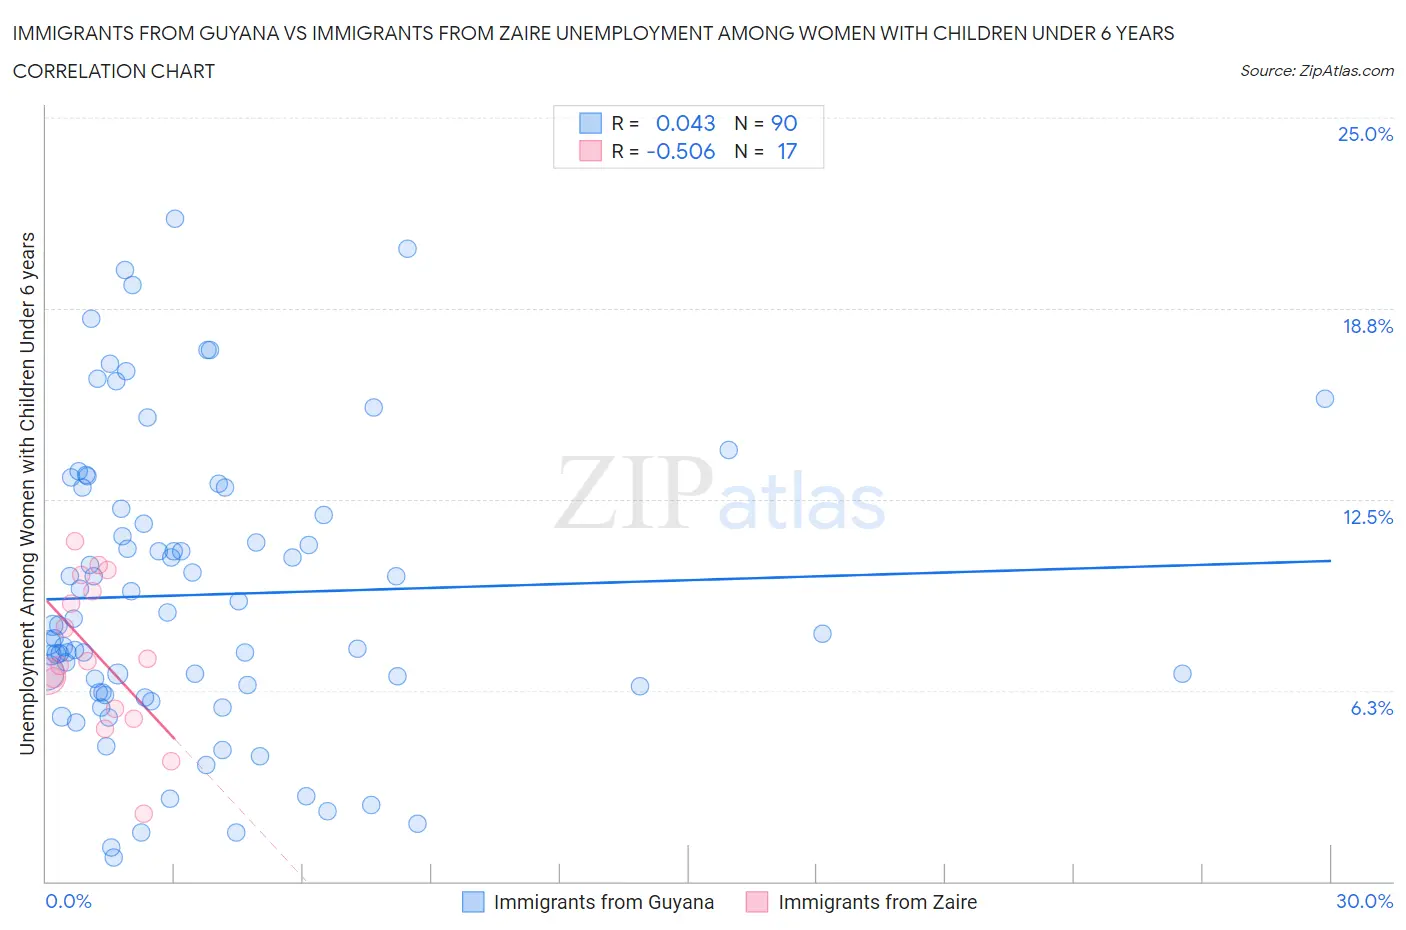
Immigrants from Guyana vs Immigrants from Zaire Unemployment Among Women with Children Under 6 years Correlation Chart
The statistical analysis conducted on geographies consisting of 155,055,932 people shows no correlation between the proportion of Immigrants from Guyana and unemployment rate among women with children under the age of 6 in the United States with a correlation coefficient (R) of 0.043 and weighted average of 8.2%. Similarly, the statistical analysis conducted on geographies consisting of 97,228,389 people shows a substantial negative correlation between the proportion of Immigrants from Zaire and unemployment rate among women with children under the age of 6 in the United States with a correlation coefficient (R) of -0.506 and weighted average of 7.3%, a difference of 12.8%.
Unemployment Among Women with Children Under 6 years Correlation Summary
| Measurement | Immigrants from Guyana | Immigrants from Zaire |
| Minimum | 0.77% | 2.2% |
| Maximum | 21.7% | 11.1% |
| Range | 20.9% | 8.9% |
| Mean | 9.4% | 7.4% |
| Median | 8.4% | 7.2% |
| Interquartile 25% (IQ1) | 6.2% | 5.5% |
| Interquartile 75% (IQ3) | 12.2% | 9.8% |
| Interquartile Range (IQR) | 6.0% | 4.3% |
| Standard Deviation (Sample) | 4.8% | 2.5% |
| Standard Deviation (Population) | 4.8% | 2.4% |
Similar Demographics by Unemployment Among Women with Children Under 6 years
Demographics Similar to Immigrants from Guyana by Unemployment Among Women with Children Under 6 years
In terms of unemployment among women with children under 6 years, the demographic groups most similar to Immigrants from Guyana are Guyanese (8.2%, a difference of 0.18%), Ghanaian (8.2%, a difference of 0.18%), Immigrants from Caribbean (8.3%, a difference of 0.27%), Nigerian (8.2%, a difference of 0.35%), and Immigrants from Sierra Leone (8.2%, a difference of 0.36%).
| Demographics | Rating | Rank | Unemployment Among Women with Children Under 6 years |
| Central Americans | 1.4 /100 | #246 | Tragic 8.2% |
| German Russians | 1.2 /100 | #247 | Tragic 8.2% |
| Immigrants | Western Africa | 1.1 /100 | #248 | Tragic 8.2% |
| Immigrants | Sierra Leone | 1.1 /100 | #249 | Tragic 8.2% |
| Nigerians | 1.1 /100 | #250 | Tragic 8.2% |
| Guyanese | 1.0 /100 | #251 | Tragic 8.2% |
| Ghanaians | 1.0 /100 | #252 | Tragic 8.2% |
| Immigrants | Guyana | 0.8 /100 | #253 | Tragic 8.2% |
| Immigrants | Caribbean | 0.7 /100 | #254 | Tragic 8.3% |
| Immigrants | Portugal | 0.6 /100 | #255 | Tragic 8.3% |
| Celtics | 0.6 /100 | #256 | Tragic 8.3% |
| British West Indians | 0.5 /100 | #257 | Tragic 8.3% |
| Immigrants | Ghana | 0.5 /100 | #258 | Tragic 8.3% |
| Barbadians | 0.4 /100 | #259 | Tragic 8.3% |
| Whites/Caucasians | 0.3 /100 | #260 | Tragic 8.4% |
Demographics Similar to Immigrants from Zaire by Unemployment Among Women with Children Under 6 years
In terms of unemployment among women with children under 6 years, the demographic groups most similar to Immigrants from Zaire are Immigrants from Bosnia and Herzegovina (7.3%, a difference of 0.050%), Immigrants from Chile (7.3%, a difference of 0.060%), Iraqi (7.3%, a difference of 0.18%), Immigrants from South Africa (7.3%, a difference of 0.20%), and South African (7.3%, a difference of 0.25%).
| Demographics | Rating | Rank | Unemployment Among Women with Children Under 6 years |
| Armenians | 95.9 /100 | #116 | Exceptional 7.2% |
| Immigrants | Kenya | 95.4 /100 | #117 | Exceptional 7.3% |
| Serbians | 94.5 /100 | #118 | Exceptional 7.3% |
| South Africans | 94.1 /100 | #119 | Exceptional 7.3% |
| Iraqis | 93.9 /100 | #120 | Exceptional 7.3% |
| Immigrants | Chile | 93.5 /100 | #121 | Exceptional 7.3% |
| Immigrants | Bosnia and Herzegovina | 93.5 /100 | #122 | Exceptional 7.3% |
| Immigrants | Zaire | 93.3 /100 | #123 | Exceptional 7.3% |
| Immigrants | South Africa | 92.5 /100 | #124 | Exceptional 7.3% |
| Pakistanis | 92.2 /100 | #125 | Exceptional 7.3% |
| Immigrants | Burma/Myanmar | 91.9 /100 | #126 | Exceptional 7.3% |
| Jordanians | 91.5 /100 | #127 | Exceptional 7.3% |
| Zimbabweans | 91.5 /100 | #128 | Exceptional 7.3% |
| Slovenes | 89.2 /100 | #129 | Excellent 7.4% |
| Swedes | 88.4 /100 | #130 | Excellent 7.4% |