Immigrants from Guatemala vs Immigrants from Bahamas Unemployment Among Women with Children Ages 6 to 17 years
COMPARE
Immigrants from Guatemala
Immigrants from Bahamas
Unemployment Among Women with Children Ages 6 to 17 years
Unemployment Among Women with Children Ages 6 to 17 years Comparison
Immigrants from Guatemala
Immigrants from Bahamas
9.4%
UNEMPLOYMENT AMONG WOMEN WITH CHILDREN AGES 6 TO 17 YEARS
1.3/ 100
METRIC RATING
250th/ 347
METRIC RANK
10.1%
UNEMPLOYMENT AMONG WOMEN WITH CHILDREN AGES 6 TO 17 YEARS
0.0/ 100
METRIC RATING
301st/ 347
METRIC RANK
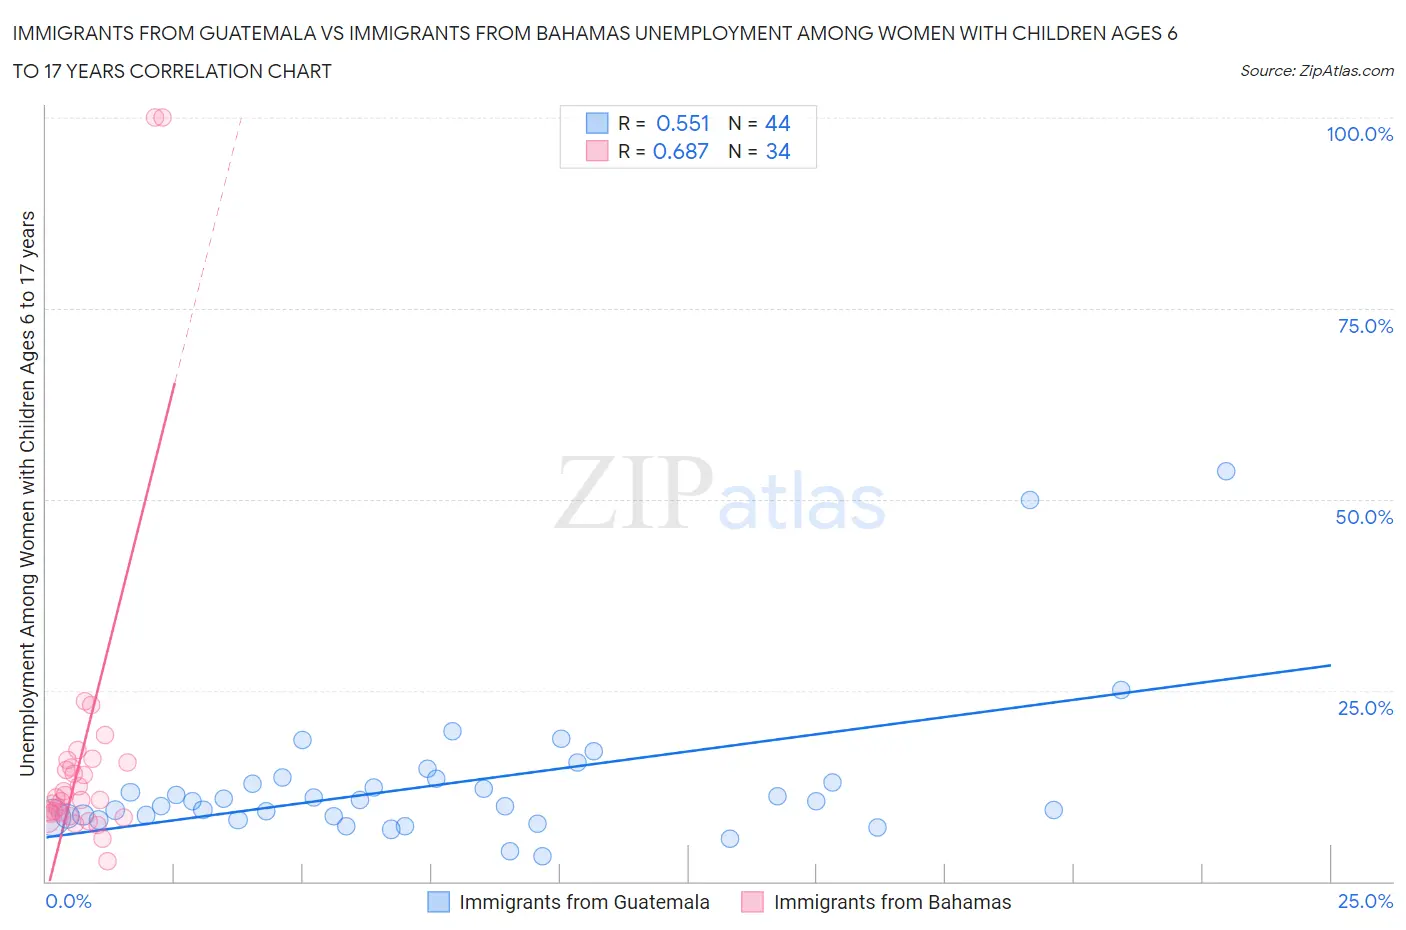
Immigrants from Guatemala vs Immigrants from Bahamas Unemployment Among Women with Children Ages 6 to 17 years Correlation Chart
The statistical analysis conducted on geographies consisting of 280,581,568 people shows a substantial positive correlation between the proportion of Immigrants from Guatemala and unemployment rate among women with children between the ages 6 and 17 in the United States with a correlation coefficient (R) of 0.551 and weighted average of 9.4%. Similarly, the statistical analysis conducted on geographies consisting of 91,256,917 people shows a significant positive correlation between the proportion of Immigrants from Bahamas and unemployment rate among women with children between the ages 6 and 17 in the United States with a correlation coefficient (R) of 0.687 and weighted average of 10.1%, a difference of 7.7%.
Unemployment Among Women with Children Ages 6 to 17 years Correlation Summary
| Measurement | Immigrants from Guatemala | Immigrants from Bahamas |
| Minimum | 3.3% | 2.7% |
| Maximum | 53.7% | 100.0% |
| Range | 50.4% | 97.3% |
| Mean | 12.8% | 17.0% |
| Median | 10.5% | 10.8% |
| Interquartile 25% (IQ1) | 8.4% | 8.9% |
| Interquartile 75% (IQ3) | 13.1% | 15.5% |
| Interquartile Range (IQR) | 4.7% | 6.6% |
| Standard Deviation (Sample) | 9.6% | 21.5% |
| Standard Deviation (Population) | 9.5% | 21.2% |
Similar Demographics by Unemployment Among Women with Children Ages 6 to 17 years
Demographics Similar to Immigrants from Guatemala by Unemployment Among Women with Children Ages 6 to 17 years
In terms of unemployment among women with children ages 6 to 17 years, the demographic groups most similar to Immigrants from Guatemala are Central American (9.4%, a difference of 0.020%), Immigrants from South America (9.4%, a difference of 0.090%), Dutch (9.4%, a difference of 0.10%), Creek (9.4%, a difference of 0.11%), and Polish (9.4%, a difference of 0.14%).
| Demographics | Rating | Rank | Unemployment Among Women with Children Ages 6 to 17 years |
| Scottish | 2.0 /100 | #243 | Tragic 9.4% |
| English | 1.9 /100 | #244 | Tragic 9.4% |
| Immigrants | Cameroon | 1.8 /100 | #245 | Tragic 9.4% |
| Immigrants | Africa | 1.6 /100 | #246 | Tragic 9.4% |
| Poles | 1.5 /100 | #247 | Tragic 9.4% |
| Dutch | 1.5 /100 | #248 | Tragic 9.4% |
| Immigrants | South America | 1.5 /100 | #249 | Tragic 9.4% |
| Immigrants | Guatemala | 1.3 /100 | #250 | Tragic 9.4% |
| Central Americans | 1.3 /100 | #251 | Tragic 9.4% |
| Creek | 1.2 /100 | #252 | Tragic 9.4% |
| Portuguese | 1.1 /100 | #253 | Tragic 9.4% |
| Nicaraguans | 1.0 /100 | #254 | Tragic 9.4% |
| Lithuanians | 0.9 /100 | #255 | Tragic 9.4% |
| Canadians | 0.8 /100 | #256 | Tragic 9.4% |
| Celtics | 0.7 /100 | #257 | Tragic 9.5% |
Demographics Similar to Immigrants from Bahamas by Unemployment Among Women with Children Ages 6 to 17 years
In terms of unemployment among women with children ages 6 to 17 years, the demographic groups most similar to Immigrants from Bahamas are Nigerian (10.1%, a difference of 0.15%), Immigrants from Honduras (10.1%, a difference of 0.18%), Immigrants from Haiti (10.1%, a difference of 0.20%), Venezuelan (10.2%, a difference of 0.45%), and Immigrants from Caribbean (10.1%, a difference of 0.50%).
| Demographics | Rating | Rank | Unemployment Among Women with Children Ages 6 to 17 years |
| Ecuadorians | 0.0 /100 | #294 | Tragic 10.0% |
| Cherokee | 0.0 /100 | #295 | Tragic 10.0% |
| Immigrants | Western Africa | 0.0 /100 | #296 | Tragic 10.1% |
| Immigrants | Caribbean | 0.0 /100 | #297 | Tragic 10.1% |
| Immigrants | Haiti | 0.0 /100 | #298 | Tragic 10.1% |
| Immigrants | Honduras | 0.0 /100 | #299 | Tragic 10.1% |
| Nigerians | 0.0 /100 | #300 | Tragic 10.1% |
| Immigrants | Bahamas | 0.0 /100 | #301 | Tragic 10.1% |
| Venezuelans | 0.0 /100 | #302 | Tragic 10.2% |
| Immigrants | Ecuador | 0.0 /100 | #303 | Tragic 10.2% |
| Immigrants | Venezuela | 0.0 /100 | #304 | Tragic 10.2% |
| Immigrants | Nigeria | 0.0 /100 | #305 | Tragic 10.2% |
| Paraguayans | 0.0 /100 | #306 | Tragic 10.2% |
| Immigrants | Senegal | 0.0 /100 | #307 | Tragic 10.2% |
| Dutch West Indians | 0.0 /100 | #308 | Tragic 10.2% |