Immigrants from Guatemala vs Bangladeshi Unemployment Among Women with Children Ages 6 to 17 years
COMPARE
Immigrants from Guatemala
Bangladeshi
Unemployment Among Women with Children Ages 6 to 17 years
Unemployment Among Women with Children Ages 6 to 17 years Comparison
Immigrants from Guatemala
Bangladeshis
9.4%
UNEMPLOYMENT AMONG WOMEN WITH CHILDREN AGES 6 TO 17 YEARS
1.3/ 100
METRIC RATING
250th/ 347
METRIC RANK
7.4%
UNEMPLOYMENT AMONG WOMEN WITH CHILDREN AGES 6 TO 17 YEARS
100.0/ 100
METRIC RATING
12th/ 347
METRIC RANK
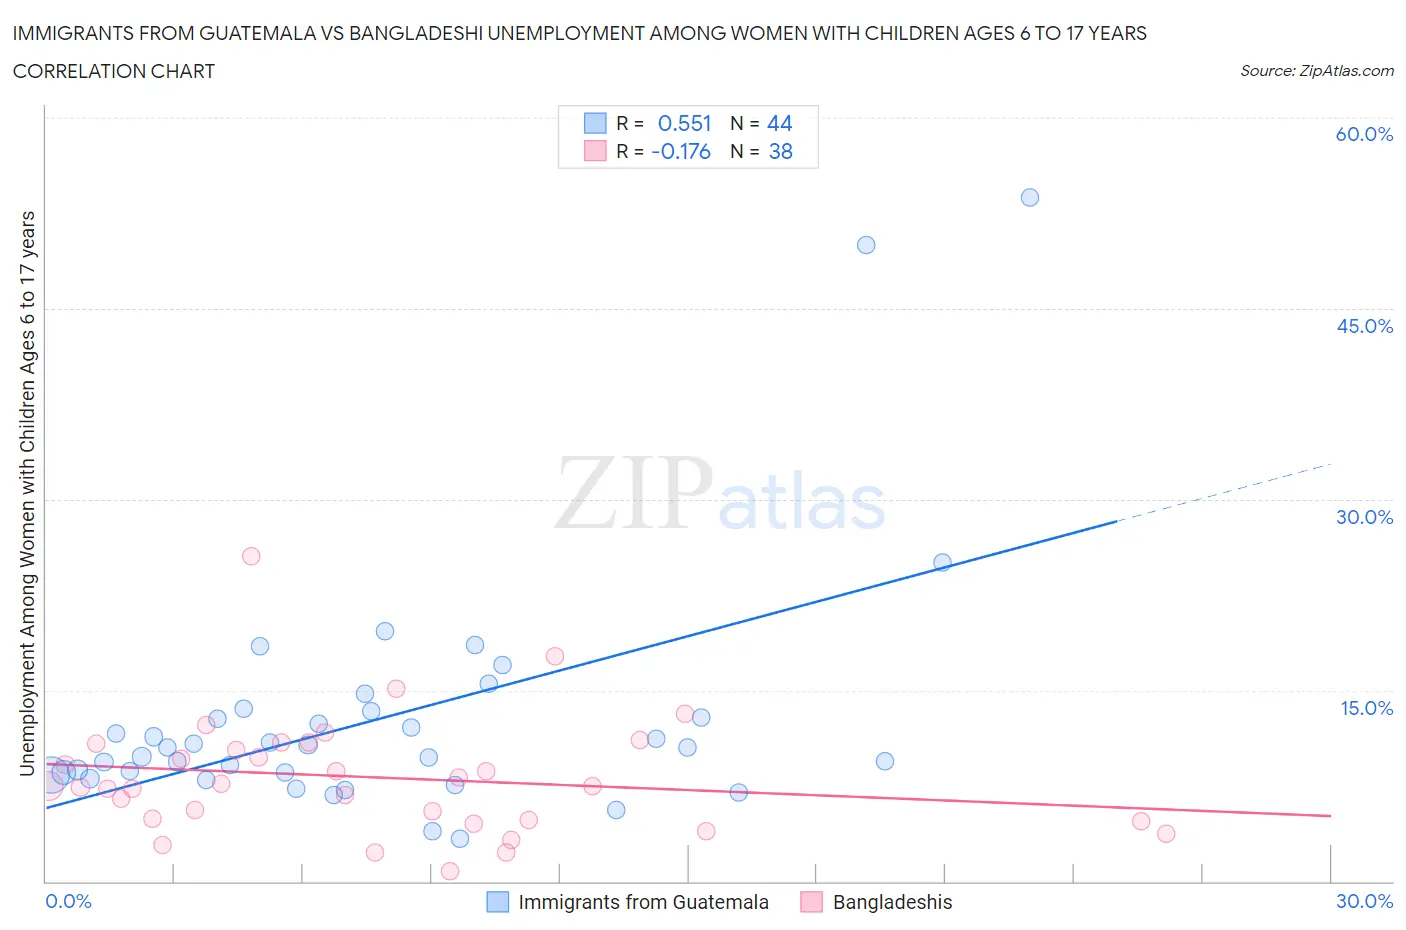
Immigrants from Guatemala vs Bangladeshi Unemployment Among Women with Children Ages 6 to 17 years Correlation Chart
The statistical analysis conducted on geographies consisting of 280,581,568 people shows a substantial positive correlation between the proportion of Immigrants from Guatemala and unemployment rate among women with children between the ages 6 and 17 in the United States with a correlation coefficient (R) of 0.551 and weighted average of 9.4%. Similarly, the statistical analysis conducted on geographies consisting of 118,644,853 people shows a poor negative correlation between the proportion of Bangladeshis and unemployment rate among women with children between the ages 6 and 17 in the United States with a correlation coefficient (R) of -0.176 and weighted average of 7.4%, a difference of 27.7%.
Unemployment Among Women with Children Ages 6 to 17 years Correlation Summary
| Measurement | Immigrants from Guatemala | Bangladeshi |
| Minimum | 3.3% | 0.80% |
| Maximum | 53.7% | 25.5% |
| Range | 50.4% | 24.7% |
| Mean | 12.8% | 8.2% |
| Median | 10.5% | 7.5% |
| Interquartile 25% (IQ1) | 8.4% | 4.8% |
| Interquartile 75% (IQ3) | 13.1% | 10.8% |
| Interquartile Range (IQR) | 4.7% | 6.0% |
| Standard Deviation (Sample) | 9.6% | 4.7% |
| Standard Deviation (Population) | 9.5% | 4.6% |
Similar Demographics by Unemployment Among Women with Children Ages 6 to 17 years
Demographics Similar to Immigrants from Guatemala by Unemployment Among Women with Children Ages 6 to 17 years
In terms of unemployment among women with children ages 6 to 17 years, the demographic groups most similar to Immigrants from Guatemala are Central American (9.4%, a difference of 0.020%), Immigrants from South America (9.4%, a difference of 0.090%), Dutch (9.4%, a difference of 0.10%), Creek (9.4%, a difference of 0.11%), and Polish (9.4%, a difference of 0.14%).
| Demographics | Rating | Rank | Unemployment Among Women with Children Ages 6 to 17 years |
| Scottish | 2.0 /100 | #243 | Tragic 9.4% |
| English | 1.9 /100 | #244 | Tragic 9.4% |
| Immigrants | Cameroon | 1.8 /100 | #245 | Tragic 9.4% |
| Immigrants | Africa | 1.6 /100 | #246 | Tragic 9.4% |
| Poles | 1.5 /100 | #247 | Tragic 9.4% |
| Dutch | 1.5 /100 | #248 | Tragic 9.4% |
| Immigrants | South America | 1.5 /100 | #249 | Tragic 9.4% |
| Immigrants | Guatemala | 1.3 /100 | #250 | Tragic 9.4% |
| Central Americans | 1.3 /100 | #251 | Tragic 9.4% |
| Creek | 1.2 /100 | #252 | Tragic 9.4% |
| Portuguese | 1.1 /100 | #253 | Tragic 9.4% |
| Nicaraguans | 1.0 /100 | #254 | Tragic 9.4% |
| Lithuanians | 0.9 /100 | #255 | Tragic 9.4% |
| Canadians | 0.8 /100 | #256 | Tragic 9.4% |
| Celtics | 0.7 /100 | #257 | Tragic 9.5% |
Demographics Similar to Bangladeshis by Unemployment Among Women with Children Ages 6 to 17 years
In terms of unemployment among women with children ages 6 to 17 years, the demographic groups most similar to Bangladeshis are Immigrants from Taiwan (7.3%, a difference of 0.33%), Indonesian (7.4%, a difference of 0.71%), Sudanese (7.4%, a difference of 0.75%), Immigrants from Fiji (7.3%, a difference of 1.0%), and Puget Sound Salish (7.5%, a difference of 1.8%).
| Demographics | Rating | Rank | Unemployment Among Women with Children Ages 6 to 17 years |
| Okinawans | 100.0 /100 | #5 | Exceptional 7.0% |
| Tlingit-Haida | 100.0 /100 | #6 | Exceptional 7.1% |
| Soviet Union | 100.0 /100 | #7 | Exceptional 7.1% |
| Immigrants | Hong Kong | 100.0 /100 | #8 | Exceptional 7.2% |
| Assyrians/Chaldeans/Syriacs | 100.0 /100 | #9 | Exceptional 7.2% |
| Immigrants | Fiji | 100.0 /100 | #10 | Exceptional 7.3% |
| Immigrants | Taiwan | 100.0 /100 | #11 | Exceptional 7.3% |
| Bangladeshis | 100.0 /100 | #12 | Exceptional 7.4% |
| Indonesians | 100.0 /100 | #13 | Exceptional 7.4% |
| Sudanese | 100.0 /100 | #14 | Exceptional 7.4% |
| Puget Sound Salish | 100.0 /100 | #15 | Exceptional 7.5% |
| Immigrants | Burma/Myanmar | 100.0 /100 | #16 | Exceptional 7.5% |
| Cambodians | 100.0 /100 | #17 | Exceptional 7.5% |
| Afghans | 100.0 /100 | #18 | Exceptional 7.6% |
| Filipinos | 100.0 /100 | #19 | Exceptional 7.6% |