Immigrants from Greece vs Marshallese Unemployment Among Ages 25 to 29 years

COMPARE

Immigrants from Greece
Race
Ancestry
AfghanAfricanAlaska NativeAlaskan AthabascanAlbanianAleutAlsatianAmericanApacheArabArapahoArgentineanArmenianAssyrian/Chaldean/SyriacAustralianAustrianBahamianBangladeshiBarbadianBasqueBelgianBelizeanBermudanBhutaneseBlackfeetBolivianBrazilianBritishBritish West IndianBulgarianBurmeseCajunCambodianCanadianCape VerdeanCarpatho RusynCelticCentral AmericanCentral American IndianCherokeeCheyenneChickasawChileanChineseChippewaChoctawColombianColvilleComancheCosta RicanCreeCreekCroatianCrowCubanCypriotCzechCzechoslovakianDanishDelawareDominicanDutchDutch West IndianEastern EuropeanEcuadorianEgyptianEnglishEstonianEthiopianEuropeanFijianFilipinoFinnishFrenchFrench American IndianFrench CanadianGermanGerman RussianGhanaianGreekGuamanian/ChamorroGuatemalanGuyaneseHaitianHmongHonduranHopiHoumaHungarianIcelanderIndian (Asian)IndonesianInupiatIranianIraqiIrishIroquoisIsraeliItalianJamaicanJapaneseJordanianKenyanKiowaKoreanLaotianLatvianLebaneseLiberianLithuanianLumbeeLuxembourgerMacedonianMalaysianMalteseMenomineeMexicanMexican American IndianMongolianMoroccanNative HawaiianNavajoNepaleseNew ZealanderNicaraguanNigerianNorthern EuropeanNorwegianOkinawanOsageOttawaPaiutePakistaniPalestinianPanamanianParaguayanPennsylvania GermanPeruvianPimaPolishPortuguesePotawatomiPuebloPuerto RicanPuget Sound SalishRomanianRussianSalvadoranSamoanScandinavianScotch-IrishScottishSeminoleSenegaleseSerbianShoshoneSierra LeoneanSiouxSlavicSlovakSloveneSomaliSouth AfricanSouth AmericanSouth American IndianSoviet UnionSpaniardSpanishSpanish AmericanSpanish American IndianSri LankanSubsaharan AfricanSudaneseSwedishSwissSyrianTaiwaneseThaiTlingit-HaidaTohono O'OdhamTonganTrinidadian and TobagonianTsimshianTurkishU.S. Virgin IslanderUgandanUkrainianUruguayanUteVenezuelanVietnameseWelshWest IndianYakamaYaquiYugoslavianYumanYup'ikZimbabwean
Immigration
NonimmigrantsImmigrantsAfghanistanAfricaAlbaniaArgentinaArmeniaAsiaAustraliaAustriaBahamasBangladeshBarbadosBelarusBelgiumBelizeBoliviaBosnia and HerzegovinaBrazilBulgariaBurma/MyanmarCabo VerdeCambodiaCameroonCanadaCaribbeanCentral AmericaChileChinaColombiaCongoCosta RicaCroatiaCubaCzechoslovakiaDenmarkDominicaDominican RepublicEastern AfricaEastern AsiaEastern EuropeEcuadorEgyptEl SalvadorEnglandEritreaEthiopiaEuropeFijiFranceGermanyGhanaGreeceGrenadaGuatemalaGuyanaHaitiHondurasHong KongHungaryIndiaIndonesiaIranIraqIrelandIsraelItalyJamaicaJapanJordanKazakhstanKenyaKoreaKuwaitLaosLatin AmericaLatviaLebanonLiberiaLithuaniaMalaysiaMexicoMicronesiaMiddle AfricaMoldovaMoroccoNepalNetherlandsNicaraguaNigeriaNorth AmericaNorth MacedoniaNorthern AfricaNorthern EuropeNorwayOceaniaPakistanPanamaPeruPhilippinesPolandPortugalRomaniaRussiaSaudi ArabiaScotlandSenegalSerbiaSierra LeoneSingaporeSomaliaSouth AfricaSouth AmericaSouth Central AsiaSouth Eastern AsiaSouthern EuropeSpainSri LankaSt. Vincent and the GrenadinesSudanSwedenSwitzerlandSyriaTaiwanThailandTrinidad and TobagoTurkeyUgandaUkraineUruguayUzbekistanVenezuelaVietnamWest IndiesWestern AfricaWestern AsiaWestern EuropeYemenZaireZimbabweAzores
Marshallese
Race
Ancestry
AfghanAfricanAlaska NativeAlaskan AthabascanAlbanianAleutAlsatianAmericanApacheArabArapahoArgentineanArmenianAssyrian/Chaldean/SyriacAustralianAustrianBahamianBangladeshiBarbadianBasqueBelgianBelizeanBermudanBhutaneseBlackfeetBolivianBrazilianBritishBritish West IndianBulgarianBurmeseCajunCambodianCanadianCape VerdeanCarpatho RusynCelticCentral AmericanCentral American IndianCherokeeCheyenneChickasawChileanChineseChippewaChoctawColombianColvilleComancheCosta RicanCreeCreekCroatianCrowCubanCypriotCzechCzechoslovakianDanishDelawareDominicanDutchDutch West IndianEastern EuropeanEcuadorianEgyptianEnglishEstonianEthiopianEuropeanFijianFilipinoFinnishFrenchFrench American IndianFrench CanadianGermanGerman RussianGhanaianGreekGuamanian/ChamorroGuatemalanGuyaneseHaitianHmongHonduranHopiHoumaHungarianIcelanderIndian (Asian)IndonesianInupiatIranianIraqiIrishIroquoisIsraeliItalianJamaicanJapaneseJordanianKenyanKiowaKoreanLaotianLatvianLebaneseLiberianLithuanianLumbeeLuxembourgerMacedonianMalaysianMalteseMarshalleseMenomineeMexicanMexican American IndianMongolianMoroccanNative HawaiianNavajoNepaleseNew ZealanderNicaraguanNigerianNorthern EuropeanNorwegianOkinawanOsageOttawaPaiutePakistaniPalestinianPanamanianParaguayanPennsylvania GermanPeruvianPimaPolishPortuguesePotawatomiPuebloPuerto RicanPuget Sound SalishRomanianRussianSalvadoranSamoanScandinavianScotch-IrishScottishSeminoleSenegaleseSerbianShoshoneSierra LeoneanSiouxSlavicSlovakSloveneSomaliSouth AfricanSouth AmericanSouth American IndianSoviet UnionSpaniardSpanishSpanish AmericanSpanish American IndianSri LankanSubsaharan AfricanSudaneseSwedishSwissSyrianTaiwaneseThaiTlingit-HaidaTohono O'OdhamTonganTrinidadian and TobagonianTsimshianTurkishU.S. Virgin IslanderUgandanUkrainianUruguayanUteVenezuelanVietnameseWelshWest IndianYakamaYaquiYugoslavianYumanYup'ikZimbabwean
Immigration
NonimmigrantsImmigrantsAfghanistanAfricaAlbaniaArgentinaArmeniaAsiaAustraliaAustriaBahamasBangladeshBarbadosBelarusBelgiumBelizeBoliviaBosnia and HerzegovinaBrazilBulgariaBurma/MyanmarCabo VerdeCambodiaCameroonCanadaCaribbeanCentral AmericaChileChinaColombiaCongoCosta RicaCroatiaCubaCzechoslovakiaDenmarkDominicaDominican RepublicEastern AfricaEastern AsiaEastern EuropeEcuadorEgyptEl SalvadorEnglandEritreaEthiopiaEuropeFijiFranceGermanyGhanaGrenadaGuatemalaGuyanaHaitiHondurasHong KongHungaryIndiaIndonesiaIranIraqIrelandIsraelItalyJamaicaJapanJordanKazakhstanKenyaKoreaKuwaitLaosLatin AmericaLatviaLebanonLiberiaLithuaniaMalaysiaMexicoMicronesiaMiddle AfricaMoldovaMoroccoNepalNetherlandsNicaraguaNigeriaNorth AmericaNorth MacedoniaNorthern AfricaNorthern EuropeNorwayOceaniaPakistanPanamaPeruPhilippinesPolandPortugalRomaniaRussiaSaudi ArabiaScotlandSenegalSerbiaSierra LeoneSingaporeSomaliaSouth AfricaSouth AmericaSouth Central AsiaSouth Eastern AsiaSouthern EuropeSpainSri LankaSt. Vincent and the GrenadinesSudanSwedenSwitzerlandSyriaTaiwanThailandTrinidad and TobagoTurkeyUgandaUkraineUruguayUzbekistanVenezuelaVietnamWest IndiesWestern AfricaWestern AsiaWestern EuropeYemenZaireZimbabweAzores
Unemployment Among Ages 25 to 29 years
Income
Poverty
Unemployment
Labor Participation
Family Structure
Vehicle Availability
Education Level
Disability

Unemployment Among Ages 25 to 29 years Comparison

Immigrants from Greece

Marshallese

Fair
Exceptional
6.7%
UNEMPLOYMENT AMONG AGES 25 TO 29 YEARS
28.0/ 100
METRIC RATING
194th/ 347
METRIC RANK
6.4%
UNEMPLOYMENT AMONG AGES 25 TO 29 YEARS
94.7/ 100
METRIC RATING
87th/ 347
METRIC RANK

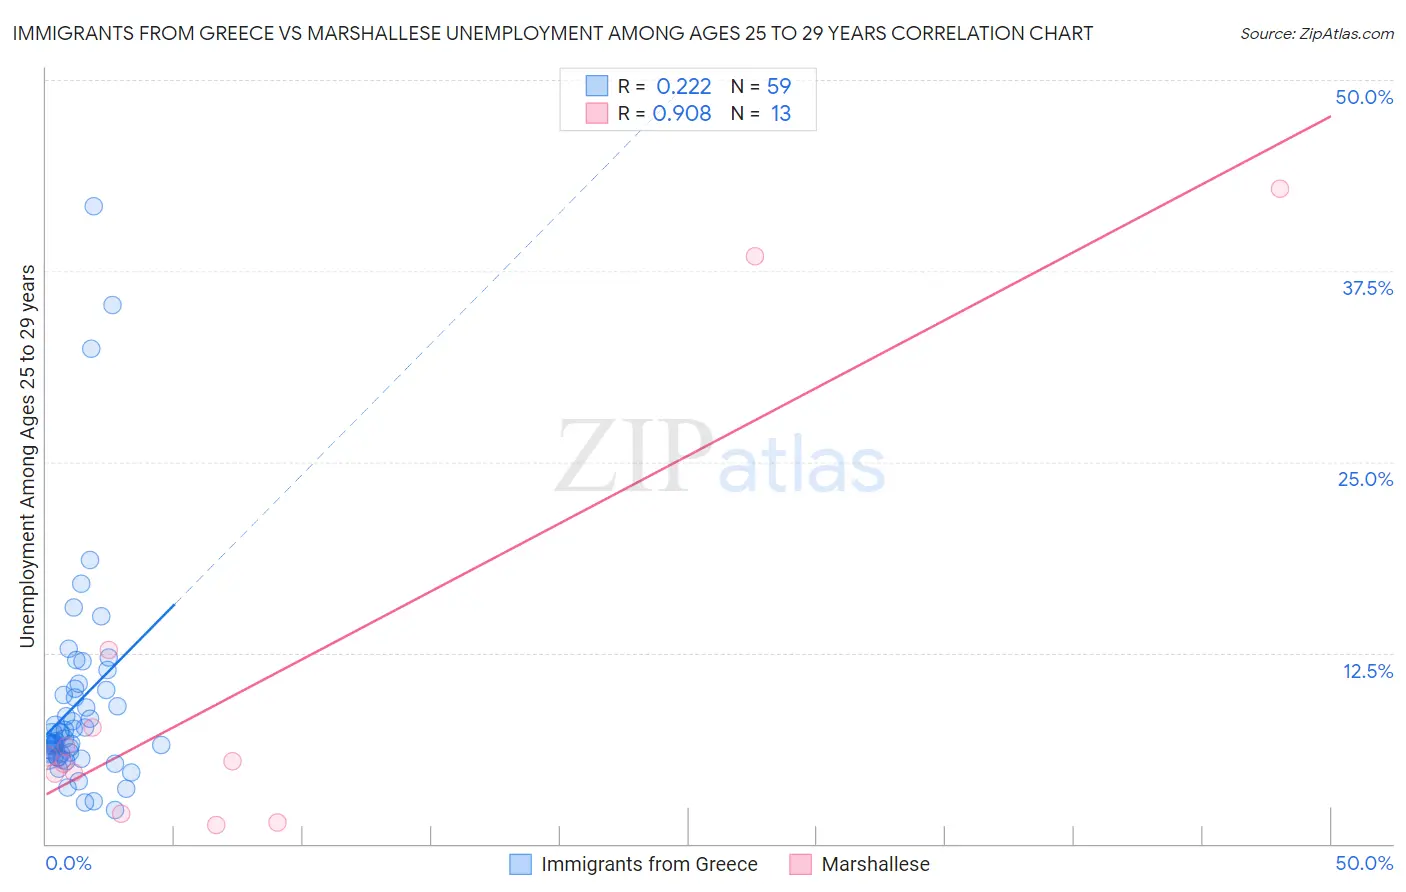
Immigrants from Greece vs Marshallese Unemployment Among Ages 25 to 29 years Correlation Chart

The statistical analysis conducted on geographies consisting of 210,073,502 people shows a weak positive correlation between the proportion of Immigrants from Greece and unemployment rate among population between the ages 25 and 29 in the United States with a correlation coefficient (R) of 0.222 and weighted average of 6.7%. Similarly, the statistical analysis conducted on geographies consisting of 14,672,046 people shows a near-perfect positive correlation between the proportion of Marshallese and unemployment rate among population between the ages 25 and 29 in the United States with a correlation coefficient (R) of 0.908 and weighted average of 6.4%, a difference of 6.2%.
Immigrants from Greece vs Marshallese Unemployment Among Ages 25 to 29 years

Unemployment Among Ages 25 to 29 years Correlation Summary

MeasurementImmigrants from GreeceMarshallese
Minimum2.2%1.2%
Maximum41.7%42.9%
Range39.5%41.7%
Mean9.2%10.6%
Median6.9%5.4%
Interquartile 25% (IQ1)5.9%3.3%
Interquartile 75% (IQ3)10.1%10.1%
Interquartile Range (IQR)4.2%6.8%
Standard Deviation (Sample)7.2%13.7%
Standard Deviation (Population)7.2%13.2%

Similar Demographics by Unemployment Among Ages 25 to 29 years

Demographics Similar to Immigrants from Greece by Unemployment Among Ages 25 to 29 years

In terms of unemployment among ages 25 to 29 years, the demographic groups most similar to Immigrants from Greece are Alsatian (6.7%, a difference of 0.0%), Immigrants from Ukraine (6.7%, a difference of 0.040%), Chickasaw (6.7%, a difference of 0.050%), Immigrants from Western Asia (6.7%, a difference of 0.060%), and Korean (6.7%, a difference of 0.090%).
DemographicsRating | RankUnemployment Among Ages 25 to 29 years
Immigrants | South America
33.0
/100
|
#187
Fair
6.7%
Irish
32.8
/100
|
#188
Fair
6.7%
Argentineans
32.1
/100
|
#189
Fair
6.7%
Koreans
29.3
/100
|
#190
Fair
6.7%
Chickasaw
28.7
/100
|
#191
Fair
6.7%
Immigrants | Ukraine
28.6
/100
|
#192
Fair
6.7%
Alsatians
28.1
/100
|
#193
Fair
6.7%
Immigrants | Greece
28.0
/100
|
#194
Fair
6.7%
Immigrants | Western Asia
27.3
/100
|
#195
Fair
6.7%
Hungarians
26.8
/100
|
#196
Fair
6.8%
Italians
26.5
/100
|
#197
Fair
6.8%
Immigrants | Southern Europe
24.6
/100
|
#198
Fair
6.8%
Guamanians/Chamorros
24.3
/100
|
#199
Fair
6.8%
South American Indians
23.3
/100
|
#200
Fair
6.8%
Basques
22.5
/100
|
#201
Fair
6.8%

Demographics Similar to Marshallese by Unemployment Among Ages 25 to 29 years

In terms of unemployment among ages 25 to 29 years, the demographic groups most similar to Marshallese are Immigrants from Asia (6.3%, a difference of 0.050%), Immigrants from Indonesia (6.4%, a difference of 0.060%), Immigrants from Sweden (6.3%, a difference of 0.15%), Immigrants from Spain (6.3%, a difference of 0.17%), and Immigrants from Oceania (6.4%, a difference of 0.17%).
DemographicsRating | RankUnemployment Among Ages 25 to 29 years
Immigrants | Romania
95.9
/100
|
#80
Exceptional
6.3%
Iranians
95.8
/100
|
#81
Exceptional
6.3%
Immigrants | Poland
95.7
/100
|
#82
Exceptional
6.3%
Slovenes
95.3
/100
|
#83
Exceptional
6.3%
Immigrants | Spain
95.2
/100
|
#84
Exceptional
6.3%
Immigrants | Sweden
95.1
/100
|
#85
Exceptional
6.3%
Immigrants | Asia
94.9
/100
|
#86
Exceptional
6.3%
Marshallese
94.7
/100
|
#87
Exceptional
6.4%
Immigrants | Indonesia
94.5
/100
|
#88
Exceptional
6.4%
Immigrants | Oceania
94.1
/100
|
#89
Exceptional
6.4%
Lebanese
93.9
/100
|
#90
Exceptional
6.4%
Egyptians
93.9
/100
|
#91
Exceptional
6.4%
Immigrants | North Macedonia
93.6
/100
|
#92
Exceptional
6.4%
Australians
93.6
/100
|
#93
Exceptional
6.4%
Zimbabweans
93.5
/100
|
#94
Exceptional
6.4%