Hopi vs Marshallese Unemployment Among Ages 25 to 29 years
COMPARE
Hopi
Marshallese
Unemployment Among Ages 25 to 29 years
Unemployment Among Ages 25 to 29 years Comparison
Hopi
Marshallese
13.5%
UNEMPLOYMENT AMONG AGES 25 TO 29 YEARS
0.0/ 100
METRIC RATING
344th/ 347
METRIC RANK
6.4%
UNEMPLOYMENT AMONG AGES 25 TO 29 YEARS
94.7/ 100
METRIC RATING
87th/ 347
METRIC RANK
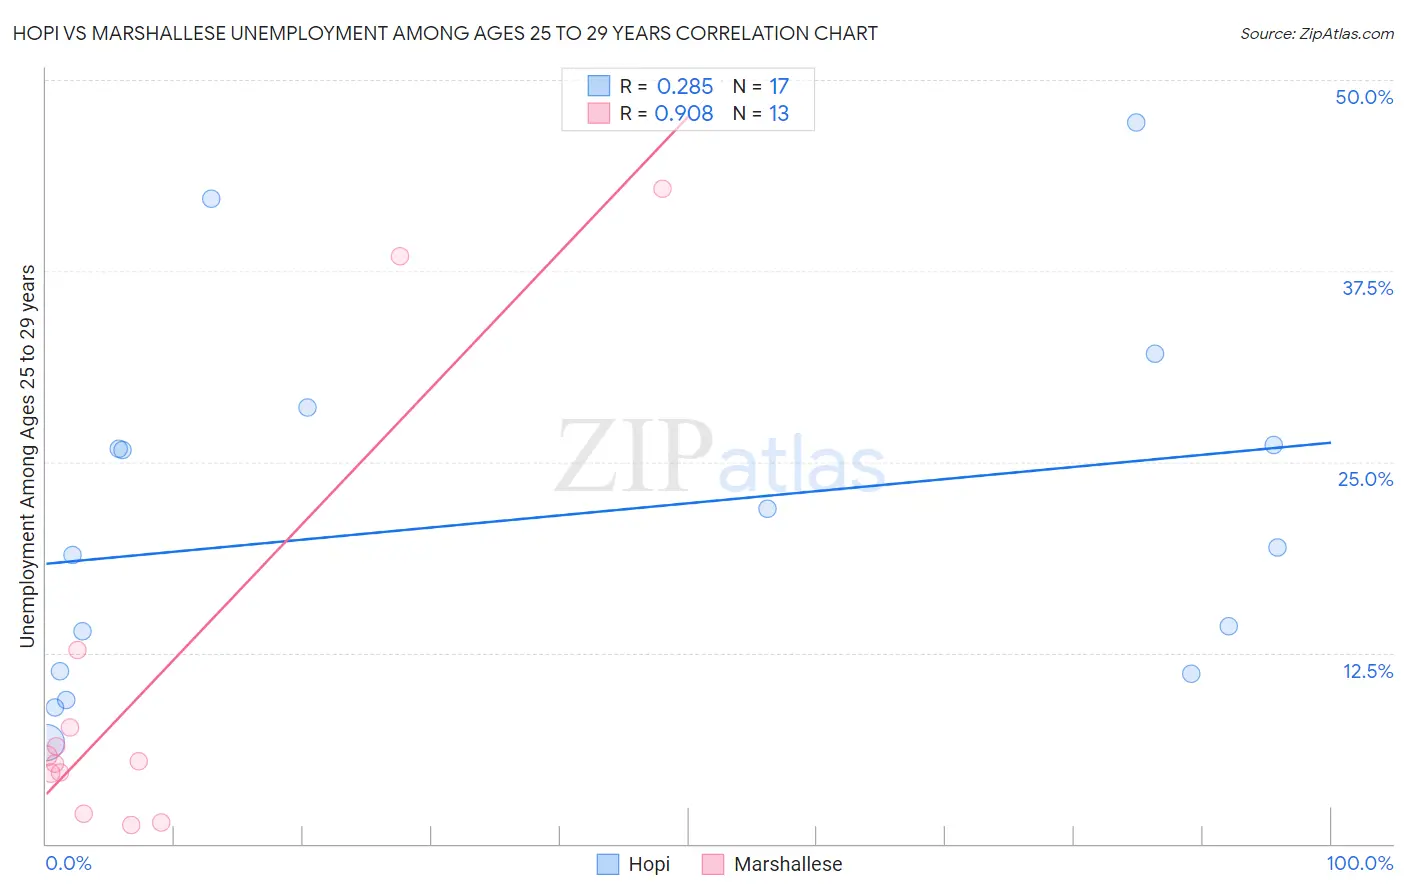
Hopi vs Marshallese Unemployment Among Ages 25 to 29 years Correlation Chart
The statistical analysis conducted on geographies consisting of 74,011,097 people shows a weak positive correlation between the proportion of Hopi and unemployment rate among population between the ages 25 and 29 in the United States with a correlation coefficient (R) of 0.285 and weighted average of 13.5%. Similarly, the statistical analysis conducted on geographies consisting of 14,672,046 people shows a near-perfect positive correlation between the proportion of Marshallese and unemployment rate among population between the ages 25 and 29 in the United States with a correlation coefficient (R) of 0.908 and weighted average of 6.4%, a difference of 112.7%.
Unemployment Among Ages 25 to 29 years Correlation Summary
| Measurement | Hopi | Marshallese |
| Minimum | 6.6% | 1.2% |
| Maximum | 47.2% | 42.9% |
| Range | 40.6% | 41.7% |
| Mean | 21.4% | 10.6% |
| Median | 19.4% | 5.4% |
| Interquartile 25% (IQ1) | 11.2% | 3.3% |
| Interquartile 75% (IQ3) | 27.3% | 10.1% |
| Interquartile Range (IQR) | 16.2% | 6.8% |
| Standard Deviation (Sample) | 11.6% | 13.7% |
| Standard Deviation (Population) | 11.3% | 13.2% |
Similar Demographics by Unemployment Among Ages 25 to 29 years
Demographics Similar to Hopi by Unemployment Among Ages 25 to 29 years
In terms of unemployment among ages 25 to 29 years, the demographic groups most similar to Hopi are Inupiat (13.4%, a difference of 0.65%), Navajo (12.2%, a difference of 11.0%), Tohono O'odham (12.1%, a difference of 11.9%), Arapaho (15.4%, a difference of 13.7%), and Crow (15.4%, a difference of 13.8%).
| Demographics | Rating | Rank | Unemployment Among Ages 25 to 29 years |
| Alaskan Athabascans | 0.0 /100 | #333 | Tragic 10.8% |
| Yuman | 0.0 /100 | #334 | Tragic 11.0% |
| Puerto Ricans | 0.0 /100 | #335 | Tragic 11.1% |
| Lumbee | 0.0 /100 | #336 | Tragic 11.2% |
| Menominee | 0.0 /100 | #337 | Tragic 11.3% |
| Sioux | 0.0 /100 | #338 | Tragic 11.7% |
| Pima | 0.0 /100 | #339 | Tragic 11.8% |
| Cheyenne | 0.0 /100 | #340 | Tragic 11.8% |
| Tohono O'odham | 0.0 /100 | #341 | Tragic 12.1% |
| Navajo | 0.0 /100 | #342 | Tragic 12.2% |
| Inupiat | 0.0 /100 | #343 | Tragic 13.4% |
| Hopi | 0.0 /100 | #344 | Tragic 13.5% |
| Arapaho | 0.0 /100 | #345 | Tragic 15.4% |
| Crow | 0.0 /100 | #346 | Tragic 15.4% |
| Yup'ik | 0.0 /100 | #347 | Tragic 17.9% |
Demographics Similar to Marshallese by Unemployment Among Ages 25 to 29 years
In terms of unemployment among ages 25 to 29 years, the demographic groups most similar to Marshallese are Immigrants from Asia (6.3%, a difference of 0.050%), Immigrants from Indonesia (6.4%, a difference of 0.060%), Immigrants from Sweden (6.3%, a difference of 0.15%), Immigrants from Spain (6.3%, a difference of 0.17%), and Immigrants from Oceania (6.4%, a difference of 0.17%).
| Demographics | Rating | Rank | Unemployment Among Ages 25 to 29 years |
| Immigrants | Romania | 95.9 /100 | #80 | Exceptional 6.3% |
| Iranians | 95.8 /100 | #81 | Exceptional 6.3% |
| Immigrants | Poland | 95.7 /100 | #82 | Exceptional 6.3% |
| Slovenes | 95.3 /100 | #83 | Exceptional 6.3% |
| Immigrants | Spain | 95.2 /100 | #84 | Exceptional 6.3% |
| Immigrants | Sweden | 95.1 /100 | #85 | Exceptional 6.3% |
| Immigrants | Asia | 94.9 /100 | #86 | Exceptional 6.3% |
| Marshallese | 94.7 /100 | #87 | Exceptional 6.4% |
| Immigrants | Indonesia | 94.5 /100 | #88 | Exceptional 6.4% |
| Immigrants | Oceania | 94.1 /100 | #89 | Exceptional 6.4% |
| Lebanese | 93.9 /100 | #90 | Exceptional 6.4% |
| Egyptians | 93.9 /100 | #91 | Exceptional 6.4% |
| Immigrants | North Macedonia | 93.6 /100 | #92 | Exceptional 6.4% |
| Australians | 93.6 /100 | #93 | Exceptional 6.4% |
| Zimbabweans | 93.5 /100 | #94 | Exceptional 6.4% |