Immigrants from Greece vs Marshallese 4th Grade
COMPARE
Immigrants from Greece
Marshallese
4th Grade
4th Grade Comparison
Immigrants from Greece
Marshallese
97.7%
4TH GRADE
83.8/ 100
METRIC RATING
141st/ 347
METRIC RANK
97.6%
4TH GRADE
60.8/ 100
METRIC RATING
161st/ 347
METRIC RANK
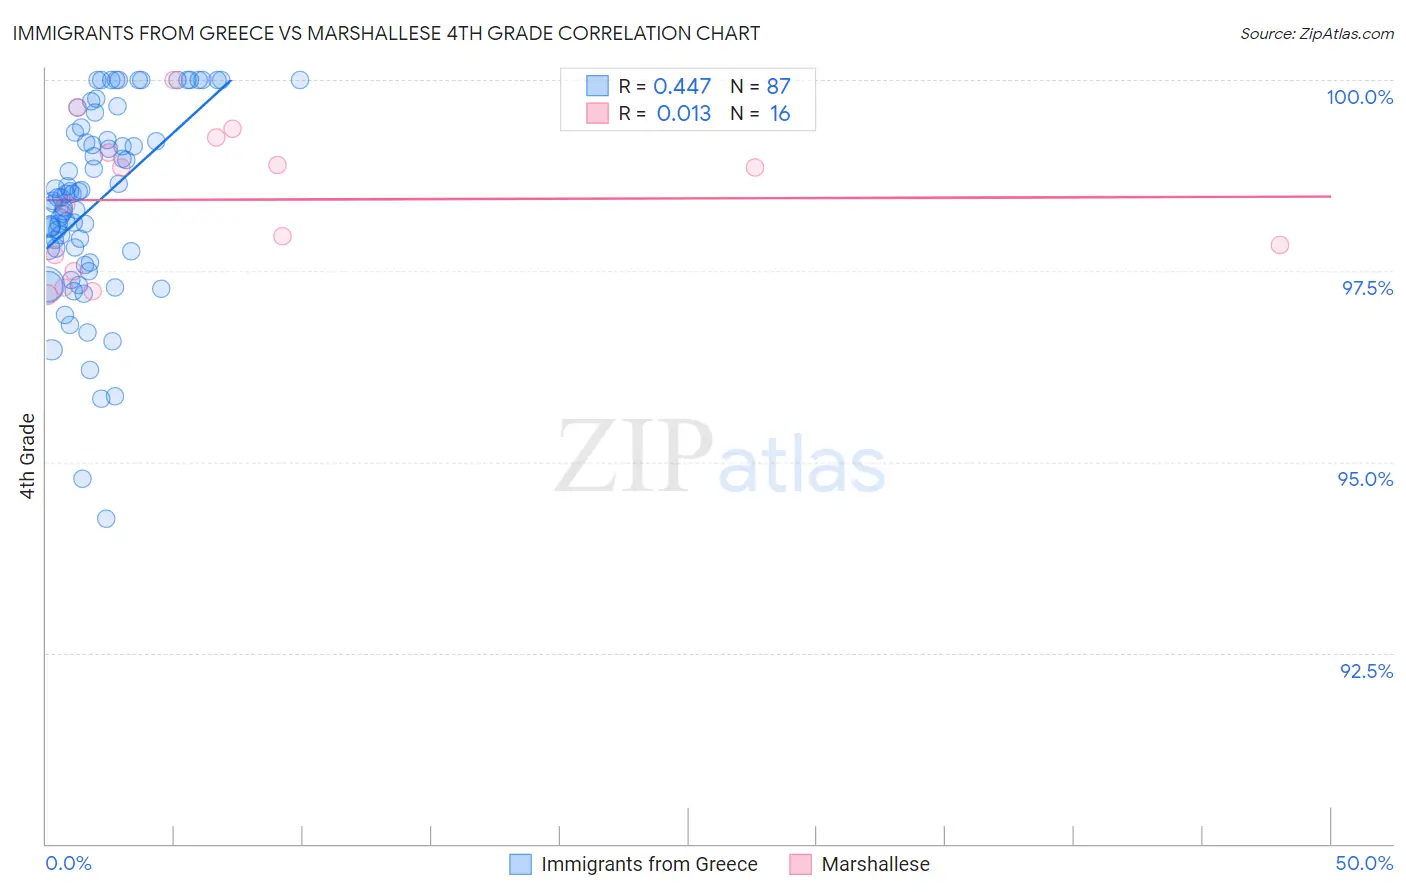
Immigrants from Greece vs Marshallese 4th Grade Correlation Chart
The statistical analysis conducted on geographies consisting of 216,879,847 people shows a moderate positive correlation between the proportion of Immigrants from Greece and percentage of population with at least 4th grade education in the United States with a correlation coefficient (R) of 0.447 and weighted average of 97.7%. Similarly, the statistical analysis conducted on geographies consisting of 14,761,315 people shows no correlation between the proportion of Marshallese and percentage of population with at least 4th grade education in the United States with a correlation coefficient (R) of 0.013 and weighted average of 97.6%, a difference of 0.11%.
4th Grade Correlation Summary
| Measurement | Immigrants from Greece | Marshallese |
| Minimum | 94.3% | 97.2% |
| Maximum | 100.0% | 100.0% |
| Range | 5.7% | 2.8% |
| Mean | 98.4% | 98.4% |
| Median | 98.5% | 98.6% |
| Interquartile 25% (IQ1) | 97.8% | 97.6% |
| Interquartile 75% (IQ3) | 99.3% | 99.1% |
| Interquartile Range (IQR) | 1.6% | 1.5% |
| Standard Deviation (Sample) | 1.2% | 0.92% |
| Standard Deviation (Population) | 1.2% | 0.89% |
Demographics Similar to Immigrants from Greece and Marshallese by 4th Grade
In terms of 4th grade, the demographic groups most similar to Immigrants from Greece are Immigrants from North Macedonia (97.7%, a difference of 0.0%), Burmese (97.7%, a difference of 0.010%), Spaniard (97.7%, a difference of 0.010%), Immigrants from Moldova (97.7%, a difference of 0.010%), and Jordanian (97.7%, a difference of 0.020%). Similarly, the demographic groups most similar to Marshallese are Apache (97.6%, a difference of 0.0%), Immigrants from Italy (97.6%, a difference of 0.010%), Immigrants from Jordan (97.6%, a difference of 0.020%), Immigrants from Bosnia and Herzegovina (97.6%, a difference of 0.020%), and French American Indian (97.6%, a difference of 0.020%).
| Demographics | Rating | Rank | 4th Grade |
| Immigrants | Greece | 83.8 /100 | #141 | Excellent 97.7% |
| Immigrants | North Macedonia | 83.3 /100 | #142 | Excellent 97.7% |
| Burmese | 82.8 /100 | #143 | Excellent 97.7% |
| Spaniards | 82.7 /100 | #144 | Excellent 97.7% |
| Immigrants | Moldova | 82.4 /100 | #145 | Excellent 97.7% |
| Jordanians | 81.3 /100 | #146 | Excellent 97.7% |
| Ute | 80.6 /100 | #147 | Excellent 97.7% |
| Hopi | 80.6 /100 | #148 | Excellent 97.7% |
| Soviet Union | 77.8 /100 | #149 | Good 97.6% |
| Immigrants | Israel | 77.7 /100 | #150 | Good 97.6% |
| Alsatians | 77.2 /100 | #151 | Good 97.6% |
| Immigrants | South Central Asia | 76.2 /100 | #152 | Good 97.6% |
| Immigrants | Eastern Europe | 71.3 /100 | #153 | Good 97.6% |
| Immigrants | Russia | 67.0 /100 | #154 | Good 97.6% |
| Albanians | 67.0 /100 | #155 | Good 97.6% |
| Immigrants | Jordan | 66.9 /100 | #156 | Good 97.6% |
| Immigrants | Bosnia and Herzegovina | 66.0 /100 | #157 | Good 97.6% |
| French American Indians | 65.9 /100 | #158 | Good 97.6% |
| Immigrants | Italy | 63.7 /100 | #159 | Good 97.6% |
| Apache | 61.3 /100 | #160 | Good 97.6% |
| Marshallese | 60.8 /100 | #161 | Good 97.6% |