Immigrants from Greece vs Immigrants from Eastern Europe Unemployment Among Ages 25 to 29 years
COMPARE
Immigrants from Greece
Immigrants from Eastern Europe
Unemployment Among Ages 25 to 29 years
Unemployment Among Ages 25 to 29 years Comparison
Immigrants from Greece
Immigrants from Eastern Europe
6.7%
UNEMPLOYMENT AMONG AGES 25 TO 29 YEARS
28.0/ 100
METRIC RATING
194th/ 347
METRIC RANK
6.4%
UNEMPLOYMENT AMONG AGES 25 TO 29 YEARS
91.9/ 100
METRIC RATING
97th/ 347
METRIC RANK
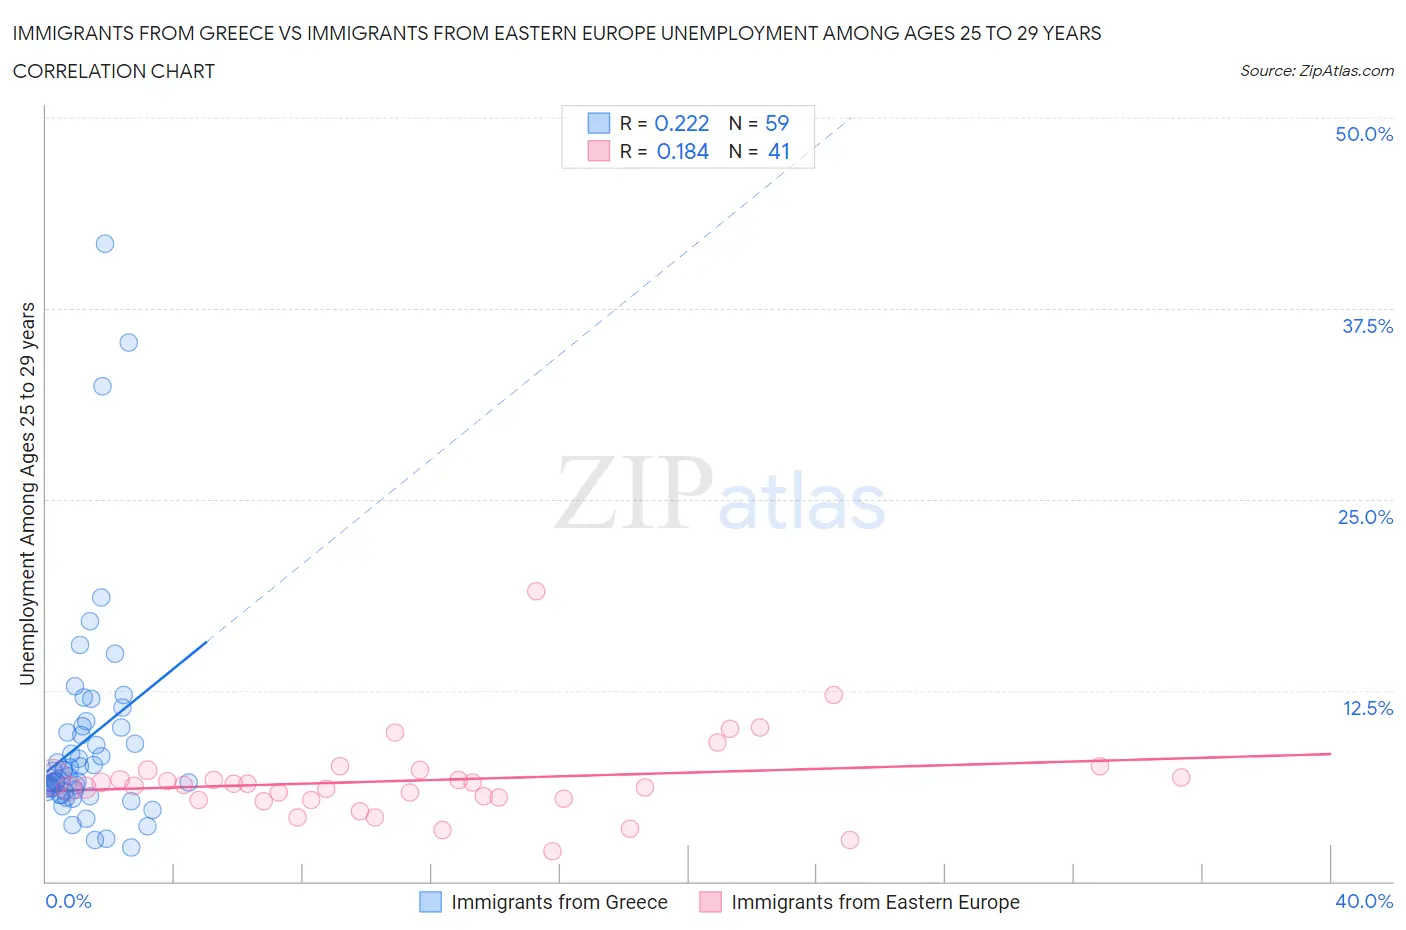
Immigrants from Greece vs Immigrants from Eastern Europe Unemployment Among Ages 25 to 29 years Correlation Chart
The statistical analysis conducted on geographies consisting of 210,073,502 people shows a weak positive correlation between the proportion of Immigrants from Greece and unemployment rate among population between the ages 25 and 29 in the United States with a correlation coefficient (R) of 0.222 and weighted average of 6.7%. Similarly, the statistical analysis conducted on geographies consisting of 442,415,438 people shows a poor positive correlation between the proportion of Immigrants from Eastern Europe and unemployment rate among population between the ages 25 and 29 in the United States with a correlation coefficient (R) of 0.184 and weighted average of 6.4%, a difference of 5.4%.
Unemployment Among Ages 25 to 29 years Correlation Summary
| Measurement | Immigrants from Greece | Immigrants from Eastern Europe |
| Minimum | 2.2% | 2.0% |
| Maximum | 41.7% | 19.0% |
| Range | 39.5% | 17.0% |
| Mean | 9.2% | 6.6% |
| Median | 6.9% | 6.3% |
| Interquartile 25% (IQ1) | 5.9% | 5.4% |
| Interquartile 75% (IQ3) | 10.1% | 7.0% |
| Interquartile Range (IQR) | 4.2% | 1.7% |
| Standard Deviation (Sample) | 7.2% | 2.8% |
| Standard Deviation (Population) | 7.2% | 2.8% |
Similar Demographics by Unemployment Among Ages 25 to 29 years
Demographics Similar to Immigrants from Greece by Unemployment Among Ages 25 to 29 years
In terms of unemployment among ages 25 to 29 years, the demographic groups most similar to Immigrants from Greece are Alsatian (6.7%, a difference of 0.0%), Immigrants from Ukraine (6.7%, a difference of 0.040%), Chickasaw (6.7%, a difference of 0.050%), Immigrants from Western Asia (6.7%, a difference of 0.060%), and Korean (6.7%, a difference of 0.090%).
| Demographics | Rating | Rank | Unemployment Among Ages 25 to 29 years |
| Immigrants | South America | 33.0 /100 | #187 | Fair 6.7% |
| Irish | 32.8 /100 | #188 | Fair 6.7% |
| Argentineans | 32.1 /100 | #189 | Fair 6.7% |
| Koreans | 29.3 /100 | #190 | Fair 6.7% |
| Chickasaw | 28.7 /100 | #191 | Fair 6.7% |
| Immigrants | Ukraine | 28.6 /100 | #192 | Fair 6.7% |
| Alsatians | 28.1 /100 | #193 | Fair 6.7% |
| Immigrants | Greece | 28.0 /100 | #194 | Fair 6.7% |
| Immigrants | Western Asia | 27.3 /100 | #195 | Fair 6.7% |
| Hungarians | 26.8 /100 | #196 | Fair 6.8% |
| Italians | 26.5 /100 | #197 | Fair 6.8% |
| Immigrants | Southern Europe | 24.6 /100 | #198 | Fair 6.8% |
| Guamanians/Chamorros | 24.3 /100 | #199 | Fair 6.8% |
| South American Indians | 23.3 /100 | #200 | Fair 6.8% |
| Basques | 22.5 /100 | #201 | Fair 6.8% |
Demographics Similar to Immigrants from Eastern Europe by Unemployment Among Ages 25 to 29 years
In terms of unemployment among ages 25 to 29 years, the demographic groups most similar to Immigrants from Eastern Europe are Serbian (6.4%, a difference of 0.030%), Immigrants from Brazil (6.4%, a difference of 0.060%), Iraqi (6.4%, a difference of 0.11%), Afghan (6.4%, a difference of 0.14%), and Uruguayan (6.4%, a difference of 0.14%).
| Demographics | Rating | Rank | Unemployment Among Ages 25 to 29 years |
| Lebanese | 93.9 /100 | #90 | Exceptional 6.4% |
| Egyptians | 93.9 /100 | #91 | Exceptional 6.4% |
| Immigrants | North Macedonia | 93.6 /100 | #92 | Exceptional 6.4% |
| Australians | 93.6 /100 | #93 | Exceptional 6.4% |
| Zimbabweans | 93.5 /100 | #94 | Exceptional 6.4% |
| Afghans | 92.5 /100 | #95 | Exceptional 6.4% |
| Immigrants | Brazil | 92.1 /100 | #96 | Exceptional 6.4% |
| Immigrants | Eastern Europe | 91.9 /100 | #97 | Exceptional 6.4% |
| Serbians | 91.7 /100 | #98 | Exceptional 6.4% |
| Iraqis | 91.3 /100 | #99 | Exceptional 6.4% |
| Uruguayans | 91.2 /100 | #100 | Exceptional 6.4% |
| Immigrants | Ireland | 91.1 /100 | #101 | Exceptional 6.4% |
| British | 90.5 /100 | #102 | Exceptional 6.4% |
| Immigrants | Congo | 90.4 /100 | #103 | Exceptional 6.4% |
| Cypriots | 90.1 /100 | #104 | Exceptional 6.4% |