Estonian vs Marshallese Unemployment Among Ages 25 to 29 years
COMPARE
Estonian
Marshallese
Unemployment Among Ages 25 to 29 years
Unemployment Among Ages 25 to 29 years Comparison
Estonians
Marshallese
6.6%
UNEMPLOYMENT AMONG AGES 25 TO 29 YEARS
54.8/ 100
METRIC RATING
168th/ 347
METRIC RANK
6.4%
UNEMPLOYMENT AMONG AGES 25 TO 29 YEARS
94.7/ 100
METRIC RATING
87th/ 347
METRIC RANK
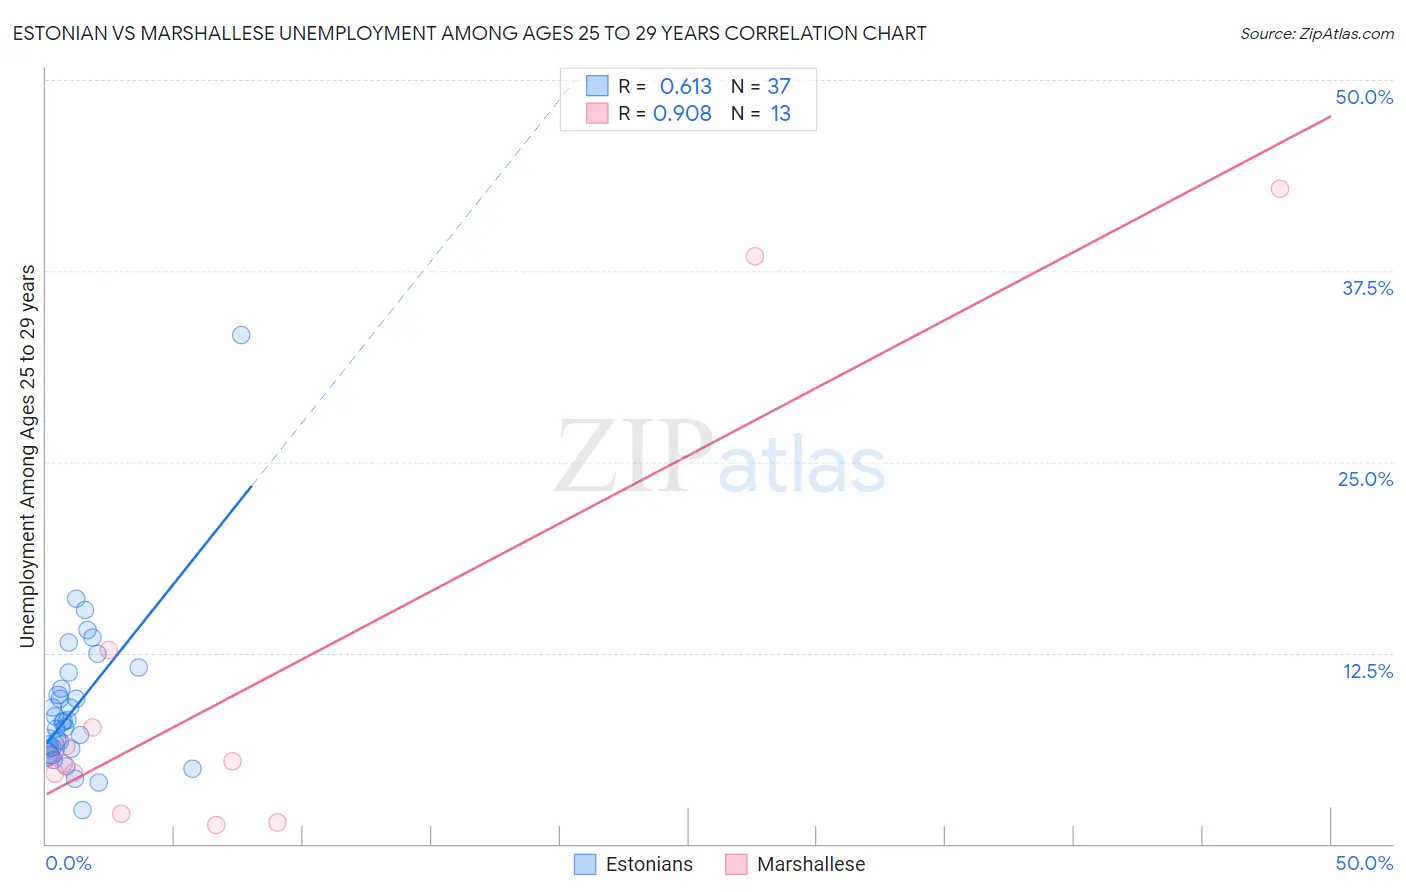
Estonian vs Marshallese Unemployment Among Ages 25 to 29 years Correlation Chart
The statistical analysis conducted on geographies consisting of 120,865,167 people shows a significant positive correlation between the proportion of Estonians and unemployment rate among population between the ages 25 and 29 in the United States with a correlation coefficient (R) of 0.613 and weighted average of 6.6%. Similarly, the statistical analysis conducted on geographies consisting of 14,672,046 people shows a near-perfect positive correlation between the proportion of Marshallese and unemployment rate among population between the ages 25 and 29 in the United States with a correlation coefficient (R) of 0.908 and weighted average of 6.4%, a difference of 4.3%.
Unemployment Among Ages 25 to 29 years Correlation Summary
| Measurement | Estonian | Marshallese |
| Minimum | 2.2% | 1.2% |
| Maximum | 33.3% | 42.9% |
| Range | 31.1% | 41.7% |
| Mean | 9.0% | 10.6% |
| Median | 8.0% | 5.4% |
| Interquartile 25% (IQ1) | 6.2% | 3.3% |
| Interquartile 75% (IQ3) | 10.7% | 10.1% |
| Interquartile Range (IQR) | 4.5% | 6.8% |
| Standard Deviation (Sample) | 5.2% | 13.7% |
| Standard Deviation (Population) | 5.2% | 13.2% |
Similar Demographics by Unemployment Among Ages 25 to 29 years
Demographics Similar to Estonians by Unemployment Among Ages 25 to 29 years
In terms of unemployment among ages 25 to 29 years, the demographic groups most similar to Estonians are Immigrants from Canada (6.6%, a difference of 0.020%), South American (6.6%, a difference of 0.020%), Albanian (6.6%, a difference of 0.080%), Immigrants from Cambodia (6.6%, a difference of 0.14%), and Immigrants from Northern Europe (6.6%, a difference of 0.16%).
| Demographics | Rating | Rank | Unemployment Among Ages 25 to 29 years |
| Paraguayans | 60.4 /100 | #161 | Good 6.6% |
| Immigrants | Czechoslovakia | 60.2 /100 | #162 | Good 6.6% |
| Immigrants | Middle Africa | 59.4 /100 | #163 | Average 6.6% |
| Greeks | 58.5 /100 | #164 | Average 6.6% |
| English | 58.0 /100 | #165 | Average 6.6% |
| Immigrants | Northern Europe | 57.3 /100 | #166 | Average 6.6% |
| Immigrants | Canada | 55.0 /100 | #167 | Average 6.6% |
| Estonians | 54.8 /100 | #168 | Average 6.6% |
| South Americans | 54.5 /100 | #169 | Average 6.6% |
| Albanians | 53.5 /100 | #170 | Average 6.6% |
| Immigrants | Cambodia | 52.6 /100 | #171 | Average 6.6% |
| Bangladeshis | 51.6 /100 | #172 | Average 6.6% |
| Russians | 51.3 /100 | #173 | Average 6.6% |
| Immigrants | North America | 50.0 /100 | #174 | Average 6.6% |
| Immigrants | South Eastern Asia | 49.1 /100 | #175 | Average 6.7% |
Demographics Similar to Marshallese by Unemployment Among Ages 25 to 29 years
In terms of unemployment among ages 25 to 29 years, the demographic groups most similar to Marshallese are Immigrants from Asia (6.3%, a difference of 0.050%), Immigrants from Indonesia (6.4%, a difference of 0.060%), Immigrants from Sweden (6.3%, a difference of 0.15%), Immigrants from Spain (6.3%, a difference of 0.17%), and Immigrants from Oceania (6.4%, a difference of 0.17%).
| Demographics | Rating | Rank | Unemployment Among Ages 25 to 29 years |
| Immigrants | Romania | 95.9 /100 | #80 | Exceptional 6.3% |
| Iranians | 95.8 /100 | #81 | Exceptional 6.3% |
| Immigrants | Poland | 95.7 /100 | #82 | Exceptional 6.3% |
| Slovenes | 95.3 /100 | #83 | Exceptional 6.3% |
| Immigrants | Spain | 95.2 /100 | #84 | Exceptional 6.3% |
| Immigrants | Sweden | 95.1 /100 | #85 | Exceptional 6.3% |
| Immigrants | Asia | 94.9 /100 | #86 | Exceptional 6.3% |
| Marshallese | 94.7 /100 | #87 | Exceptional 6.4% |
| Immigrants | Indonesia | 94.5 /100 | #88 | Exceptional 6.4% |
| Immigrants | Oceania | 94.1 /100 | #89 | Exceptional 6.4% |
| Lebanese | 93.9 /100 | #90 | Exceptional 6.4% |
| Egyptians | 93.9 /100 | #91 | Exceptional 6.4% |
| Immigrants | North Macedonia | 93.6 /100 | #92 | Exceptional 6.4% |
| Australians | 93.6 /100 | #93 | Exceptional 6.4% |
| Zimbabweans | 93.5 /100 | #94 | Exceptional 6.4% |