Immigrants from Barbados vs Immigrants from Yemen Female Unemployment
COMPARE
Immigrants from Barbados
Immigrants from Yemen
Female Unemployment
Female Unemployment Comparison
Immigrants from Barbados
Immigrants from Yemen
6.2%
FEMALE UNEMPLOYMENT
0.0/ 100
METRIC RATING
301st/ 347
METRIC RANK
7.8%
FEMALE UNEMPLOYMENT
0.0/ 100
METRIC RATING
339th/ 347
METRIC RANK
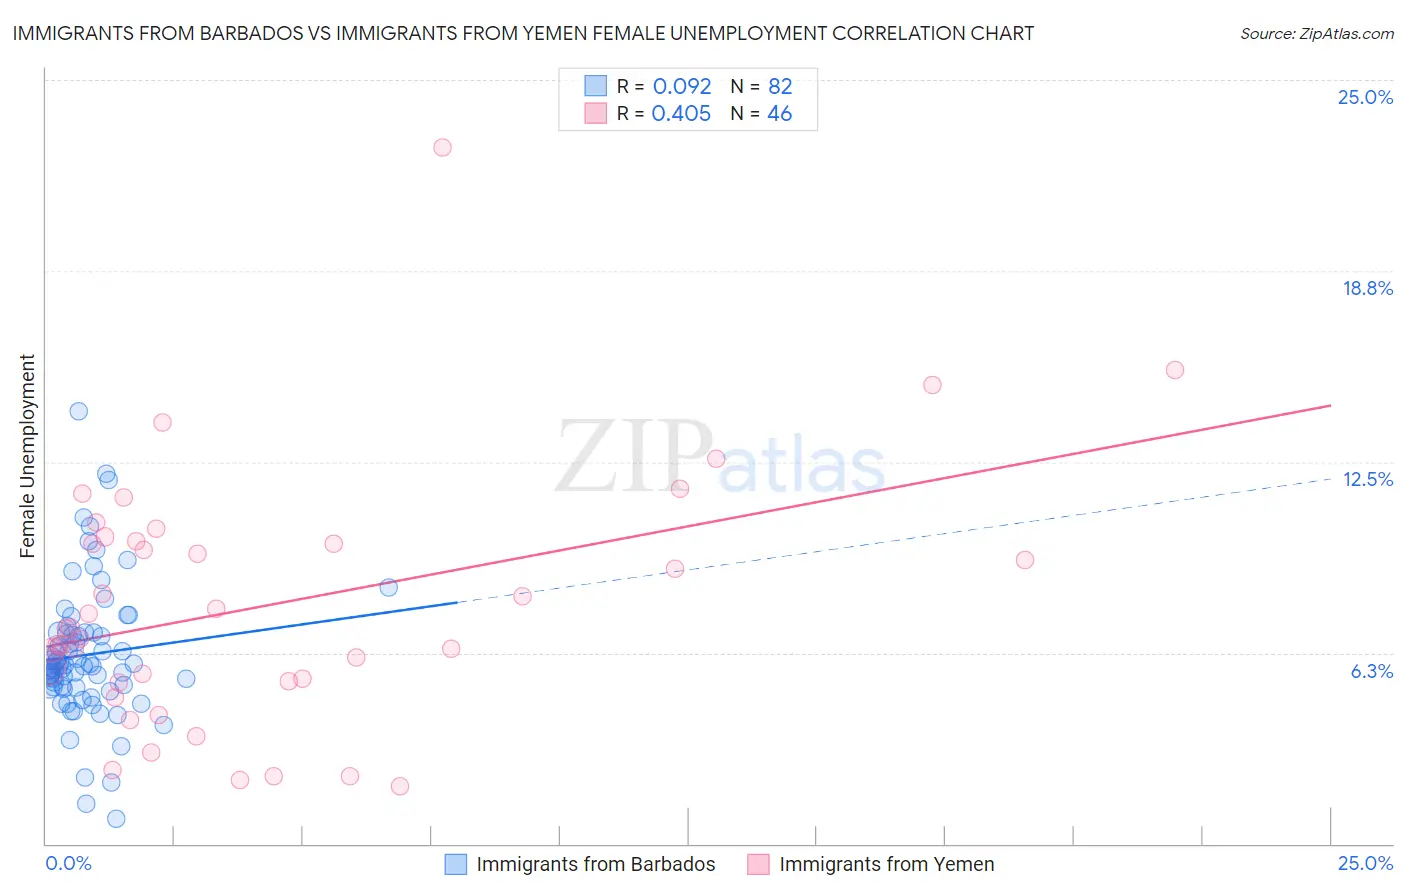
Immigrants from Barbados vs Immigrants from Yemen Female Unemployment Correlation Chart
The statistical analysis conducted on geographies consisting of 112,711,300 people shows a slight positive correlation between the proportion of Immigrants from Barbados and unemploymnet rate among females in the United States with a correlation coefficient (R) of 0.092 and weighted average of 6.2%. Similarly, the statistical analysis conducted on geographies consisting of 82,406,299 people shows a moderate positive correlation between the proportion of Immigrants from Yemen and unemploymnet rate among females in the United States with a correlation coefficient (R) of 0.405 and weighted average of 7.8%, a difference of 27.2%.
Female Unemployment Correlation Summary
| Measurement | Immigrants from Barbados | Immigrants from Yemen |
| Minimum | 0.80% | 1.9% |
| Maximum | 14.2% | 22.8% |
| Range | 13.4% | 20.9% |
| Mean | 6.2% | 7.8% |
| Median | 5.8% | 7.1% |
| Interquartile 25% (IQ1) | 5.1% | 5.3% |
| Interquartile 75% (IQ3) | 6.9% | 9.9% |
| Interquartile Range (IQR) | 1.8% | 4.6% |
| Standard Deviation (Sample) | 2.2% | 4.1% |
| Standard Deviation (Population) | 2.2% | 4.1% |
Similar Demographics by Female Unemployment
Demographics Similar to Immigrants from Barbados by Female Unemployment
In terms of female unemployment, the demographic groups most similar to Immigrants from Barbados are U.S. Virgin Islander (6.2%, a difference of 0.15%), Immigrants from Haiti (6.1%, a difference of 0.45%), Ute (6.1%, a difference of 0.50%), Barbadian (6.2%, a difference of 0.50%), and Jamaican (6.1%, a difference of 0.60%).
| Demographics | Rating | Rank | Female Unemployment |
| Immigrants | El Salvador | 0.0 /100 | #294 | Tragic 6.1% |
| Immigrants | Latin America | 0.0 /100 | #295 | Tragic 6.1% |
| Alaskan Athabascans | 0.0 /100 | #296 | Tragic 6.1% |
| West Indians | 0.0 /100 | #297 | Tragic 6.1% |
| Jamaicans | 0.0 /100 | #298 | Tragic 6.1% |
| Ute | 0.0 /100 | #299 | Tragic 6.1% |
| Immigrants | Haiti | 0.0 /100 | #300 | Tragic 6.1% |
| Immigrants | Barbados | 0.0 /100 | #301 | Tragic 6.2% |
| U.S. Virgin Islanders | 0.0 /100 | #302 | Tragic 6.2% |
| Barbadians | 0.0 /100 | #303 | Tragic 6.2% |
| Immigrants | Jamaica | 0.0 /100 | #304 | Tragic 6.2% |
| Spanish American Indians | 0.0 /100 | #305 | Tragic 6.2% |
| Immigrants | Central America | 0.0 /100 | #306 | Tragic 6.2% |
| Shoshone | 0.0 /100 | #307 | Tragic 6.2% |
| Hispanics or Latinos | 0.0 /100 | #308 | Tragic 6.2% |
Demographics Similar to Immigrants from Yemen by Female Unemployment
In terms of female unemployment, the demographic groups most similar to Immigrants from Yemen are Tohono O'odham (7.7%, a difference of 1.2%), Hopi (8.1%, a difference of 3.3%), Inupiat (8.2%, a difference of 4.1%), Puerto Rican (8.3%, a difference of 6.4%), and Navajo (7.3%, a difference of 7.6%).
| Demographics | Rating | Rank | Female Unemployment |
| Sioux | 0.0 /100 | #332 | Tragic 7.0% |
| Menominee | 0.0 /100 | #333 | Tragic 7.0% |
| Immigrants | Armenia | 0.0 /100 | #334 | Tragic 7.1% |
| Dominicans | 0.0 /100 | #335 | Tragic 7.2% |
| Immigrants | Dominican Republic | 0.0 /100 | #336 | Tragic 7.2% |
| Navajo | 0.0 /100 | #337 | Tragic 7.3% |
| Tohono O'odham | 0.0 /100 | #338 | Tragic 7.7% |
| Immigrants | Yemen | 0.0 /100 | #339 | Tragic 7.8% |
| Hopi | 0.0 /100 | #340 | Tragic 8.1% |
| Inupiat | 0.0 /100 | #341 | Tragic 8.2% |
| Puerto Ricans | 0.0 /100 | #342 | Tragic 8.3% |
| Arapaho | 0.0 /100 | #343 | Tragic 8.8% |
| Pima | 0.0 /100 | #344 | Tragic 9.3% |
| Yuman | 0.0 /100 | #345 | Tragic 9.6% |
| Yup'ik | 0.0 /100 | #346 | Tragic 10.9% |