Houma vs Arapaho Unemployment Among Ages 55 to 59 years
COMPARE
Houma
Arapaho
Unemployment Among Ages 55 to 59 years
Unemployment Among Ages 55 to 59 years Comparison
Houma
Arapaho
5.6%
UNEMPLOYMENT AMONG AGES 55 TO 59 YEARS
0.0/ 100
METRIC RATING
311th/ 347
METRIC RANK
6.1%
UNEMPLOYMENT AMONG AGES 55 TO 59 YEARS
0.0/ 100
METRIC RATING
327th/ 347
METRIC RANK
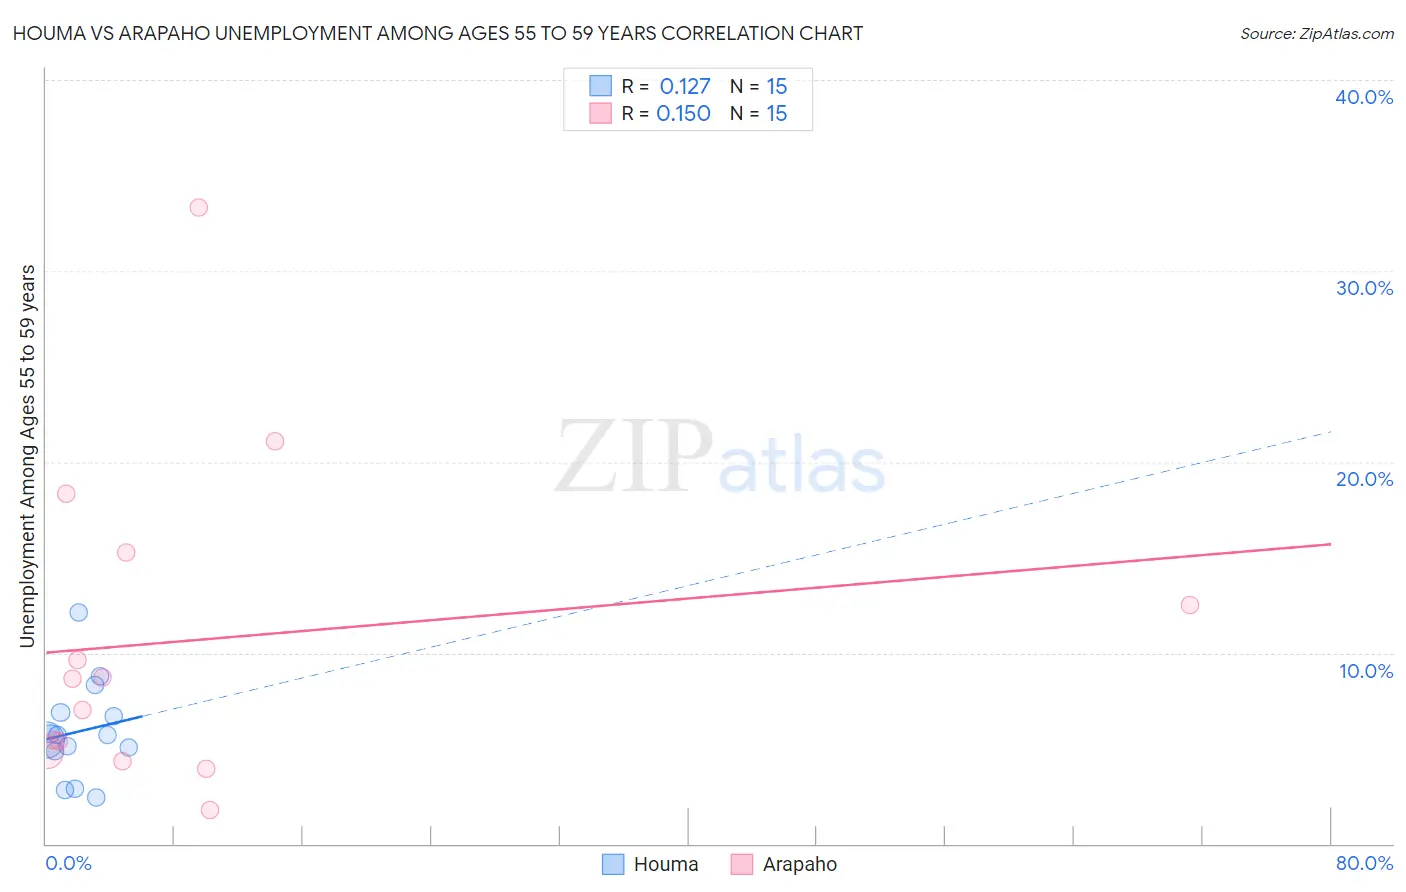
Houma vs Arapaho Unemployment Among Ages 55 to 59 years Correlation Chart
The statistical analysis conducted on geographies consisting of 35,803,241 people shows a poor positive correlation between the proportion of Houma and unemployment rate among population between the ages 55 and 59 in the United States with a correlation coefficient (R) of 0.127 and weighted average of 5.6%. Similarly, the statistical analysis conducted on geographies consisting of 28,926,135 people shows a poor positive correlation between the proportion of Arapaho and unemployment rate among population between the ages 55 and 59 in the United States with a correlation coefficient (R) of 0.150 and weighted average of 6.1%, a difference of 7.7%.
Unemployment Among Ages 55 to 59 years Correlation Summary
| Measurement | Houma | Arapaho |
| Minimum | 2.4% | 1.8% |
| Maximum | 12.1% | 33.3% |
| Range | 9.7% | 31.5% |
| Mean | 5.9% | 10.7% |
| Median | 5.7% | 8.6% |
| Interquartile 25% (IQ1) | 4.8% | 4.8% |
| Interquartile 75% (IQ3) | 6.9% | 15.2% |
| Interquartile Range (IQR) | 2.0% | 10.5% |
| Standard Deviation (Sample) | 2.5% | 8.4% |
| Standard Deviation (Population) | 2.4% | 8.1% |
Demographics Similar to Houma and Arapaho by Unemployment Among Ages 55 to 59 years
In terms of unemployment among ages 55 to 59 years, the demographic groups most similar to Houma are Belizean (5.6%, a difference of 0.18%), Ecuadorian (5.6%, a difference of 0.21%), Central American Indian (5.6%, a difference of 0.41%), Nepalese (5.6%, a difference of 0.62%), and Tlingit-Haida (5.7%, a difference of 0.69%). Similarly, the demographic groups most similar to Arapaho are Native/Alaskan (6.0%, a difference of 0.88%), Yuman (6.1%, a difference of 1.2%), Immigrants from Armenia (6.0%, a difference of 1.3%), Dominican (6.2%, a difference of 2.6%), and Vietnamese (5.9%, a difference of 3.0%).
| Demographics | Rating | Rank | Unemployment Among Ages 55 to 59 years |
| Nepalese | 0.0 /100 | #309 | Tragic 5.6% |
| Belizeans | 0.0 /100 | #310 | Tragic 5.6% |
| Houma | 0.0 /100 | #311 | Tragic 5.6% |
| Ecuadorians | 0.0 /100 | #312 | Tragic 5.6% |
| Central American Indians | 0.0 /100 | #313 | Tragic 5.6% |
| Tlingit-Haida | 0.0 /100 | #314 | Tragic 5.7% |
| Guyanese | 0.0 /100 | #315 | Tragic 5.7% |
| Immigrants | Ecuador | 0.0 /100 | #316 | Tragic 5.7% |
| Hmong | 0.0 /100 | #317 | Tragic 5.7% |
| Immigrants | Guyana | 0.0 /100 | #318 | Tragic 5.8% |
| Kiowa | 0.0 /100 | #319 | Tragic 5.8% |
| Immigrants | Azores | 0.0 /100 | #320 | Tragic 5.8% |
| Chippewa | 0.0 /100 | #321 | Tragic 5.9% |
| Crow | 0.0 /100 | #322 | Tragic 5.9% |
| Immigrants | Bangladesh | 0.0 /100 | #323 | Tragic 5.9% |
| Vietnamese | 0.0 /100 | #324 | Tragic 5.9% |
| Immigrants | Armenia | 0.0 /100 | #325 | Tragic 6.0% |
| Natives/Alaskans | 0.0 /100 | #326 | Tragic 6.0% |
| Arapaho | 0.0 /100 | #327 | Tragic 6.1% |
| Yuman | 0.0 /100 | #328 | Tragic 6.1% |
| Dominicans | 0.0 /100 | #329 | Tragic 6.2% |