Immigrants from Eritrea vs Assyrian/Chaldean/Syriac Unemployment Among Ages 55 to 59 years
COMPARE
Immigrants from Eritrea
Assyrian/Chaldean/Syriac
Unemployment Among Ages 55 to 59 years
Unemployment Among Ages 55 to 59 years Comparison
Immigrants from Eritrea
Assyrians/Chaldeans/Syriacs
4.4%
UNEMPLOYMENT AMONG AGES 55 TO 59 YEARS
100.0/ 100
METRIC RATING
25th/ 347
METRIC RANK
4.5%
UNEMPLOYMENT AMONG AGES 55 TO 59 YEARS
99.9/ 100
METRIC RATING
38th/ 347
METRIC RANK
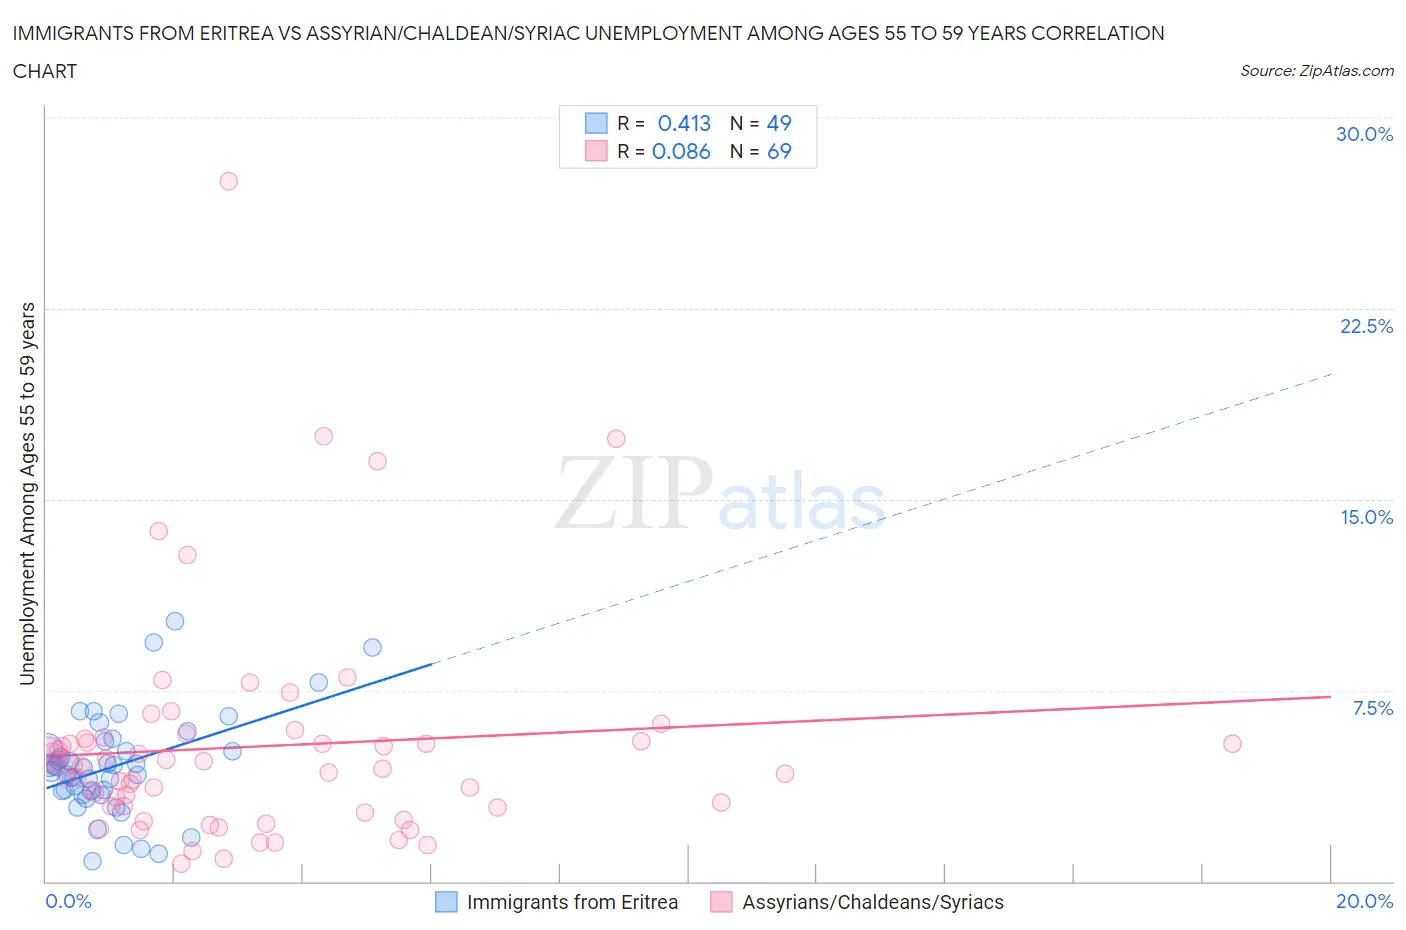
Immigrants from Eritrea vs Assyrian/Chaldean/Syriac Unemployment Among Ages 55 to 59 years Correlation Chart
The statistical analysis conducted on geographies consisting of 103,259,839 people shows a moderate positive correlation between the proportion of Immigrants from Eritrea and unemployment rate among population between the ages 55 and 59 in the United States with a correlation coefficient (R) of 0.413 and weighted average of 4.4%. Similarly, the statistical analysis conducted on geographies consisting of 108,497,216 people shows a slight positive correlation between the proportion of Assyrians/Chaldeans/Syriacs and unemployment rate among population between the ages 55 and 59 in the United States with a correlation coefficient (R) of 0.086 and weighted average of 4.5%, a difference of 0.97%.
Unemployment Among Ages 55 to 59 years Correlation Summary
| Measurement | Immigrants from Eritrea | Assyrian/Chaldean/Syriac |
| Minimum | 0.80% | 0.69% |
| Maximum | 10.2% | 27.5% |
| Range | 9.4% | 26.8% |
| Mean | 4.5% | 5.3% |
| Median | 4.5% | 4.5% |
| Interquartile 25% (IQ1) | 3.5% | 2.9% |
| Interquartile 75% (IQ3) | 5.3% | 5.6% |
| Interquartile Range (IQR) | 1.9% | 2.6% |
| Standard Deviation (Sample) | 2.0% | 4.4% |
| Standard Deviation (Population) | 2.0% | 4.4% |
Demographics Similar to Immigrants from Eritrea and Assyrians/Chaldeans/Syriacs by Unemployment Among Ages 55 to 59 years
In terms of unemployment among ages 55 to 59 years, the demographic groups most similar to Immigrants from Eritrea are Jordanian (4.4%, a difference of 0.010%), Scandinavian (4.5%, a difference of 0.17%), Immigrants from Zimbabwe (4.5%, a difference of 0.18%), Immigrants from Eastern Africa (4.5%, a difference of 0.22%), and Palestinian (4.5%, a difference of 0.26%). Similarly, the demographic groups most similar to Assyrians/Chaldeans/Syriacs are Ethiopian (4.5%, a difference of 0.18%), Immigrants from Bulgaria (4.5%, a difference of 0.18%), English (4.5%, a difference of 0.26%), Cypriot (4.5%, a difference of 0.27%), and Thai (4.5%, a difference of 0.29%).
| Demographics | Rating | Rank | Unemployment Among Ages 55 to 59 years |
| Puget Sound Salish | 100.0 /100 | #21 | Exceptional 4.4% |
| Immigrants | Burma/Myanmar | 100.0 /100 | #22 | Exceptional 4.4% |
| Kenyans | 100.0 /100 | #23 | Exceptional 4.4% |
| Jordanians | 100.0 /100 | #24 | Exceptional 4.4% |
| Immigrants | Eritrea | 100.0 /100 | #25 | Exceptional 4.4% |
| Scandinavians | 99.9 /100 | #26 | Exceptional 4.5% |
| Immigrants | Zimbabwe | 99.9 /100 | #27 | Exceptional 4.5% |
| Immigrants | Eastern Africa | 99.9 /100 | #28 | Exceptional 4.5% |
| Palestinians | 99.9 /100 | #29 | Exceptional 4.5% |
| Immigrants | Kenya | 99.9 /100 | #30 | Exceptional 4.5% |
| Germans | 99.9 /100 | #31 | Exceptional 4.5% |
| Immigrants | Ethiopia | 99.9 /100 | #32 | Exceptional 4.5% |
| Belgians | 99.9 /100 | #33 | Exceptional 4.5% |
| Thais | 99.9 /100 | #34 | Exceptional 4.5% |
| Cypriots | 99.9 /100 | #35 | Exceptional 4.5% |
| Ethiopians | 99.9 /100 | #36 | Exceptional 4.5% |
| Immigrants | Bulgaria | 99.9 /100 | #37 | Exceptional 4.5% |
| Assyrians/Chaldeans/Syriacs | 99.9 /100 | #38 | Exceptional 4.5% |
| English | 99.9 /100 | #39 | Exceptional 4.5% |
| Swiss | 99.8 /100 | #40 | Exceptional 4.5% |
| Luxembourgers | 99.8 /100 | #41 | Exceptional 4.5% |