Immigrants from Eastern Europe vs French Canadian Female Unemployment
COMPARE
Immigrants from Eastern Europe
French Canadian
Female Unemployment
Female Unemployment Comparison
Immigrants from Eastern Europe
French Canadians
5.1%
FEMALE UNEMPLOYMENT
81.5/ 100
METRIC RATING
141st/ 347
METRIC RANK
4.8%
FEMALE UNEMPLOYMENT
99.7/ 100
METRIC RATING
35th/ 347
METRIC RANK
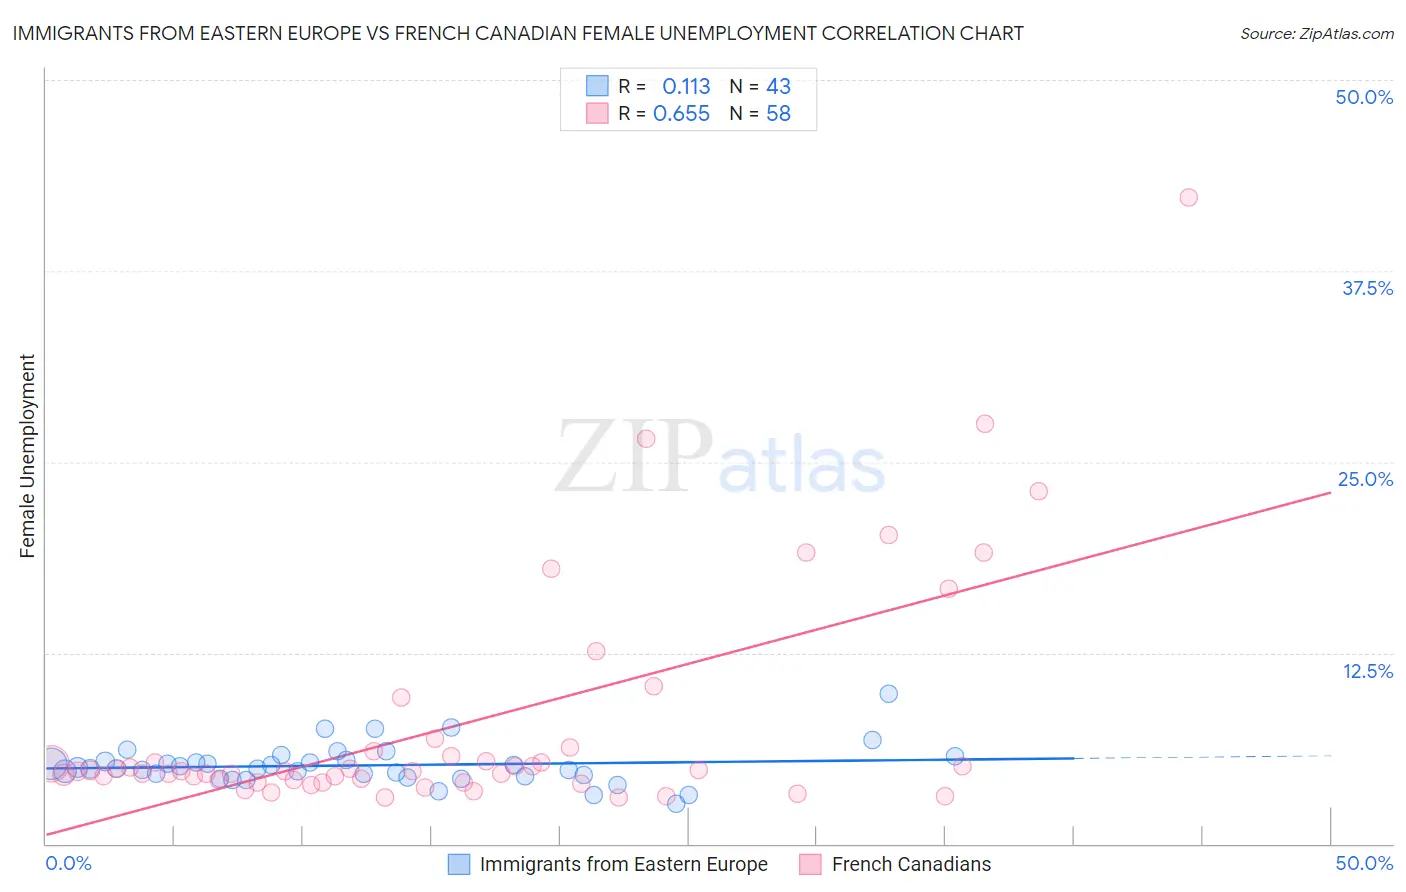
Immigrants from Eastern Europe vs French Canadian Female Unemployment Correlation Chart
The statistical analysis conducted on geographies consisting of 471,678,219 people shows a poor positive correlation between the proportion of Immigrants from Eastern Europe and unemploymnet rate among females in the United States with a correlation coefficient (R) of 0.113 and weighted average of 5.1%. Similarly, the statistical analysis conducted on geographies consisting of 495,462,199 people shows a significant positive correlation between the proportion of French Canadians and unemploymnet rate among females in the United States with a correlation coefficient (R) of 0.655 and weighted average of 4.8%, a difference of 7.2%.
Female Unemployment Correlation Summary
| Measurement | Immigrants from Eastern Europe | French Canadian |
| Minimum | 2.6% | 3.0% |
| Maximum | 9.8% | 42.3% |
| Range | 7.2% | 39.3% |
| Mean | 5.1% | 7.8% |
| Median | 4.9% | 4.7% |
| Interquartile 25% (IQ1) | 4.4% | 4.1% |
| Interquartile 75% (IQ3) | 5.5% | 6.0% |
| Interquartile Range (IQR) | 1.1% | 1.9% |
| Standard Deviation (Sample) | 1.3% | 7.6% |
| Standard Deviation (Population) | 1.3% | 7.6% |
Similar Demographics by Female Unemployment
Demographics Similar to Immigrants from Eastern Europe by Female Unemployment
In terms of female unemployment, the demographic groups most similar to Immigrants from Eastern Europe are Palestinian (5.1%, a difference of 0.080%), Immigrants from Kazakhstan (5.1%, a difference of 0.090%), Immigrants from Jordan (5.1%, a difference of 0.11%), Immigrants from France (5.1%, a difference of 0.12%), and Immigrants from Eastern Asia (5.1%, a difference of 0.16%).
| Demographics | Rating | Rank | Female Unemployment |
| Immigrants | Eritrea | 84.6 /100 | #134 | Excellent 5.1% |
| Immigrants | Latvia | 84.6 /100 | #135 | Excellent 5.1% |
| Indians (Asian) | 84.2 /100 | #136 | Excellent 5.1% |
| Pakistanis | 83.8 /100 | #137 | Excellent 5.1% |
| Chickasaw | 83.2 /100 | #138 | Excellent 5.1% |
| Immigrants | Eastern Asia | 83.0 /100 | #139 | Excellent 5.1% |
| Immigrants | France | 82.7 /100 | #140 | Excellent 5.1% |
| Immigrants | Eastern Europe | 81.5 /100 | #141 | Excellent 5.1% |
| Palestinians | 80.8 /100 | #142 | Excellent 5.1% |
| Immigrants | Kazakhstan | 80.7 /100 | #143 | Excellent 5.1% |
| Immigrants | Jordan | 80.4 /100 | #144 | Excellent 5.1% |
| Immigrants | Oceania | 79.5 /100 | #145 | Good 5.2% |
| Immigrants | Norway | 79.4 /100 | #146 | Good 5.2% |
| Argentineans | 79.2 /100 | #147 | Good 5.2% |
| Immigrants | Argentina | 78.7 /100 | #148 | Good 5.2% |
Demographics Similar to French Canadians by Female Unemployment
In terms of female unemployment, the demographic groups most similar to French Canadians are Zimbabwean (4.8%, a difference of 0.060%), Czechoslovakian (4.8%, a difference of 0.10%), Yugoslavian (4.8%, a difference of 0.15%), Pennsylvania German (4.8%, a difference of 0.51%), and Slovak (4.8%, a difference of 0.61%).
| Demographics | Rating | Rank | Female Unemployment |
| Irish | 99.9 /100 | #28 | Exceptional 4.7% |
| Cypriots | 99.9 /100 | #29 | Exceptional 4.7% |
| Lithuanians | 99.8 /100 | #30 | Exceptional 4.7% |
| Sudanese | 99.8 /100 | #31 | Exceptional 4.8% |
| Slovaks | 99.8 /100 | #32 | Exceptional 4.8% |
| Czechoslovakians | 99.7 /100 | #33 | Exceptional 4.8% |
| Zimbabweans | 99.7 /100 | #34 | Exceptional 4.8% |
| French Canadians | 99.7 /100 | #35 | Exceptional 4.8% |
| Yugoslavians | 99.7 /100 | #36 | Exceptional 4.8% |
| Pennsylvania Germans | 99.6 /100 | #37 | Exceptional 4.8% |
| Northern Europeans | 99.6 /100 | #38 | Exceptional 4.8% |
| Scotch-Irish | 99.6 /100 | #39 | Exceptional 4.8% |
| French | 99.6 /100 | #40 | Exceptional 4.8% |
| Tongans | 99.5 /100 | #41 | Exceptional 4.8% |
| Italians | 99.5 /100 | #42 | Exceptional 4.8% |