Immigrants from Eastern Asia vs Immigrants from South Africa Female Unemployment
COMPARE
Immigrants from Eastern Asia
Immigrants from South Africa
Female Unemployment
Female Unemployment Comparison
Immigrants from Eastern Asia
Immigrants from South Africa
5.1%
FEMALE UNEMPLOYMENT
83.0/ 100
METRIC RATING
139th/ 347
METRIC RANK
5.1%
FEMALE UNEMPLOYMENT
87.6/ 100
METRIC RATING
123rd/ 347
METRIC RANK
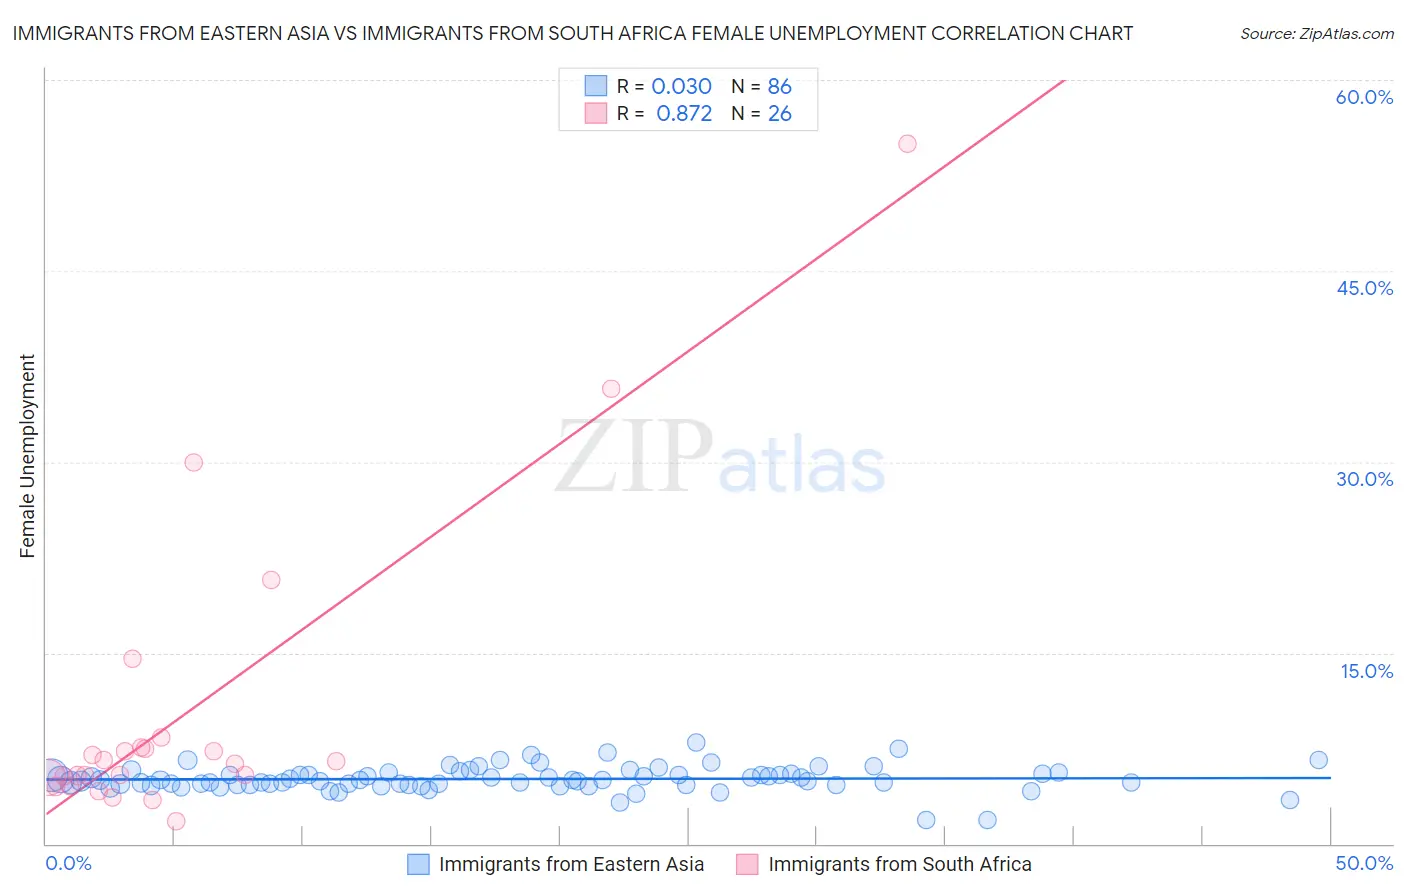
Immigrants from Eastern Asia vs Immigrants from South Africa Female Unemployment Correlation Chart
The statistical analysis conducted on geographies consisting of 495,373,600 people shows no correlation between the proportion of Immigrants from Eastern Asia and unemploymnet rate among females in the United States with a correlation coefficient (R) of 0.030 and weighted average of 5.1%. Similarly, the statistical analysis conducted on geographies consisting of 232,687,706 people shows a very strong positive correlation between the proportion of Immigrants from South Africa and unemploymnet rate among females in the United States with a correlation coefficient (R) of 0.872 and weighted average of 5.1%, a difference of 0.57%.
Female Unemployment Correlation Summary
| Measurement | Immigrants from Eastern Asia | Immigrants from South Africa |
| Minimum | 1.9% | 1.8% |
| Maximum | 8.0% | 55.0% |
| Range | 6.1% | 53.2% |
| Mean | 5.1% | 10.5% |
| Median | 5.0% | 6.4% |
| Interquartile 25% (IQ1) | 4.6% | 5.2% |
| Interquartile 75% (IQ3) | 5.5% | 7.6% |
| Interquartile Range (IQR) | 0.85% | 2.4% |
| Standard Deviation (Sample) | 0.97% | 12.1% |
| Standard Deviation (Population) | 0.96% | 11.9% |
Demographics Similar to Immigrants from Eastern Asia and Immigrants from South Africa by Female Unemployment
In terms of female unemployment, the demographic groups most similar to Immigrants from Eastern Asia are Chickasaw (5.1%, a difference of 0.020%), Immigrants from France (5.1%, a difference of 0.040%), Pakistani (5.1%, a difference of 0.080%), Indian (Asian) (5.1%, a difference of 0.13%), and Immigrants from Eastern Europe (5.1%, a difference of 0.16%). Similarly, the demographic groups most similar to Immigrants from South Africa are Immigrants from Germany (5.1%, a difference of 0.0%), Immigrants from Europe (5.1%, a difference of 0.050%), Immigrants from Western Europe (5.1%, a difference of 0.080%), Basque (5.1%, a difference of 0.15%), and Immigrants from Korea (5.1%, a difference of 0.17%).
| Demographics | Rating | Rank | Female Unemployment |
| Immigrants | Western Europe | 88.1 /100 | #121 | Excellent 5.1% |
| Immigrants | Germany | 87.6 /100 | #122 | Excellent 5.1% |
| Immigrants | South Africa | 87.6 /100 | #123 | Excellent 5.1% |
| Immigrants | Europe | 87.2 /100 | #124 | Excellent 5.1% |
| Basques | 86.5 /100 | #125 | Excellent 5.1% |
| Immigrants | Korea | 86.3 /100 | #126 | Excellent 5.1% |
| Immigrants | Hungary | 86.0 /100 | #127 | Excellent 5.1% |
| Chileans | 85.8 /100 | #128 | Excellent 5.1% |
| Ethiopians | 85.7 /100 | #129 | Excellent 5.1% |
| Maltese | 85.5 /100 | #130 | Excellent 5.1% |
| Immigrants | Ethiopia | 85.4 /100 | #131 | Excellent 5.1% |
| Immigrants | Sri Lanka | 85.0 /100 | #132 | Excellent 5.1% |
| Immigrants | Hong Kong | 84.8 /100 | #133 | Excellent 5.1% |
| Immigrants | Eritrea | 84.6 /100 | #134 | Excellent 5.1% |
| Immigrants | Latvia | 84.6 /100 | #135 | Excellent 5.1% |
| Indians (Asian) | 84.2 /100 | #136 | Excellent 5.1% |
| Pakistanis | 83.8 /100 | #137 | Excellent 5.1% |
| Chickasaw | 83.2 /100 | #138 | Excellent 5.1% |
| Immigrants | Eastern Asia | 83.0 /100 | #139 | Excellent 5.1% |
| Immigrants | France | 82.7 /100 | #140 | Excellent 5.1% |
| Immigrants | Eastern Europe | 81.5 /100 | #141 | Excellent 5.1% |