Immigrants from Eastern Asia vs Immigrants from Panama Unemployment Among Ages 30 to 34 years
COMPARE
Immigrants from Eastern Asia
Immigrants from Panama
Unemployment Among Ages 30 to 34 years
Unemployment Among Ages 30 to 34 years Comparison
Immigrants from Eastern Asia
Immigrants from Panama
5.1%
UNEMPLOYMENT AMONG AGES 30 TO 34 YEARS
96.9/ 100
METRIC RATING
64th/ 347
METRIC RANK
5.7%
UNEMPLOYMENT AMONG AGES 30 TO 34 YEARS
5.9/ 100
METRIC RATING
214th/ 347
METRIC RANK
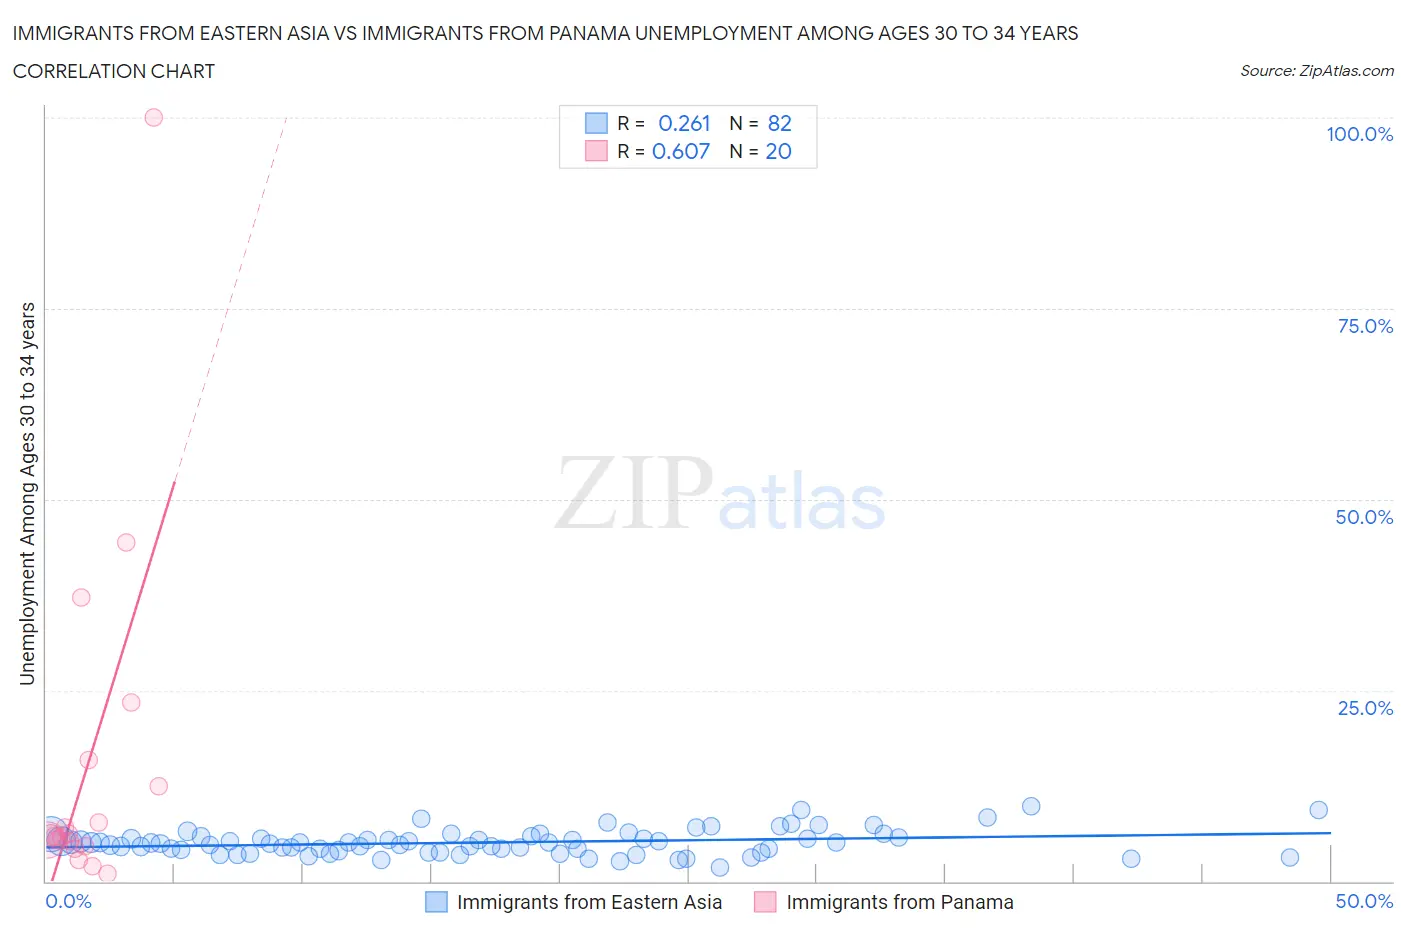
Immigrants from Eastern Asia vs Immigrants from Panama Unemployment Among Ages 30 to 34 years Correlation Chart
The statistical analysis conducted on geographies consisting of 457,725,166 people shows a weak positive correlation between the proportion of Immigrants from Eastern Asia and unemployment rate among population between the ages 30 and 34 in the United States with a correlation coefficient (R) of 0.261 and weighted average of 5.1%. Similarly, the statistical analysis conducted on geographies consisting of 215,543,896 people shows a significant positive correlation between the proportion of Immigrants from Panama and unemployment rate among population between the ages 30 and 34 in the United States with a correlation coefficient (R) of 0.607 and weighted average of 5.7%, a difference of 11.5%.
Unemployment Among Ages 30 to 34 years Correlation Summary
| Measurement | Immigrants from Eastern Asia | Immigrants from Panama |
| Minimum | 1.8% | 1.0% |
| Maximum | 9.8% | 100.0% |
| Range | 8.0% | 99.0% |
| Mean | 5.1% | 15.1% |
| Median | 5.1% | 5.9% |
| Interquartile 25% (IQ1) | 4.0% | 4.9% |
| Interquartile 75% (IQ3) | 5.7% | 14.2% |
| Interquartile Range (IQR) | 1.7% | 9.3% |
| Standard Deviation (Sample) | 1.6% | 23.1% |
| Standard Deviation (Population) | 1.6% | 22.5% |
Similar Demographics by Unemployment Among Ages 30 to 34 years
Demographics Similar to Immigrants from Eastern Asia by Unemployment Among Ages 30 to 34 years
In terms of unemployment among ages 30 to 34 years, the demographic groups most similar to Immigrants from Eastern Asia are Belgian (5.1%, a difference of 0.020%), Immigrants from France (5.1%, a difference of 0.030%), Indian (Asian) (5.1%, a difference of 0.050%), Immigrants from Japan (5.1%, a difference of 0.070%), and Immigrants from Somalia (5.1%, a difference of 0.080%).
| Demographics | Rating | Rank | Unemployment Among Ages 30 to 34 years |
| Immigrants | China | 97.2 /100 | #57 | Exceptional 5.1% |
| Asians | 97.2 /100 | #58 | Exceptional 5.1% |
| Swedes | 97.1 /100 | #59 | Exceptional 5.1% |
| Immigrants | Somalia | 97.1 /100 | #60 | Exceptional 5.1% |
| Indians (Asian) | 97.0 /100 | #61 | Exceptional 5.1% |
| Immigrants | France | 97.0 /100 | #62 | Exceptional 5.1% |
| Belgians | 97.0 /100 | #63 | Exceptional 5.1% |
| Immigrants | Eastern Asia | 96.9 /100 | #64 | Exceptional 5.1% |
| Immigrants | Japan | 96.8 /100 | #65 | Exceptional 5.1% |
| Immigrants | Zimbabwe | 96.7 /100 | #66 | Exceptional 5.1% |
| Burmese | 96.5 /100 | #67 | Exceptional 5.1% |
| Jordanians | 96.5 /100 | #68 | Exceptional 5.1% |
| Immigrants | Northern Africa | 96.4 /100 | #69 | Exceptional 5.1% |
| Immigrants | Iraq | 96.4 /100 | #70 | Exceptional 5.1% |
| Paraguayans | 96.4 /100 | #71 | Exceptional 5.1% |
Demographics Similar to Immigrants from Panama by Unemployment Among Ages 30 to 34 years
In terms of unemployment among ages 30 to 34 years, the demographic groups most similar to Immigrants from Panama are Immigrants from Cambodia (5.7%, a difference of 0.010%), Immigrants from Syria (5.7%, a difference of 0.12%), Immigrants from Fiji (5.7%, a difference of 0.26%), Immigrants (5.7%, a difference of 0.34%), and Panamanian (5.8%, a difference of 0.47%).
| Demographics | Rating | Rank | Unemployment Among Ages 30 to 34 years |
| Israelis | 12.8 /100 | #207 | Poor 5.6% |
| Immigrants | Philippines | 11.5 /100 | #208 | Poor 5.7% |
| French | 10.8 /100 | #209 | Poor 5.7% |
| Whites/Caucasians | 9.2 /100 | #210 | Tragic 5.7% |
| Spanish American Indians | 8.7 /100 | #211 | Tragic 5.7% |
| Scotch-Irish | 8.6 /100 | #212 | Tragic 5.7% |
| Immigrants | Immigrants | 7.1 /100 | #213 | Tragic 5.7% |
| Immigrants | Panama | 5.9 /100 | #214 | Tragic 5.7% |
| Immigrants | Cambodia | 5.8 /100 | #215 | Tragic 5.7% |
| Immigrants | Syria | 5.5 /100 | #216 | Tragic 5.7% |
| Immigrants | Fiji | 5.1 /100 | #217 | Tragic 5.7% |
| Panamanians | 4.5 /100 | #218 | Tragic 5.8% |
| French Canadians | 4.4 /100 | #219 | Tragic 5.8% |
| Sierra Leoneans | 3.9 /100 | #220 | Tragic 5.8% |
| Guamanians/Chamorros | 3.9 /100 | #221 | Tragic 5.8% |