Pakistani vs Immigrants from Korea Unemployment Among Ages 30 to 34 years
COMPARE
Pakistani
Immigrants from Korea
Unemployment Among Ages 30 to 34 years
Unemployment Among Ages 30 to 34 years Comparison
Pakistanis
Immigrants from Korea
5.4%
UNEMPLOYMENT AMONG AGES 30 TO 34 YEARS
74.6/ 100
METRIC RATING
136th/ 347
METRIC RANK
5.2%
UNEMPLOYMENT AMONG AGES 30 TO 34 YEARS
94.1/ 100
METRIC RATING
83rd/ 347
METRIC RANK
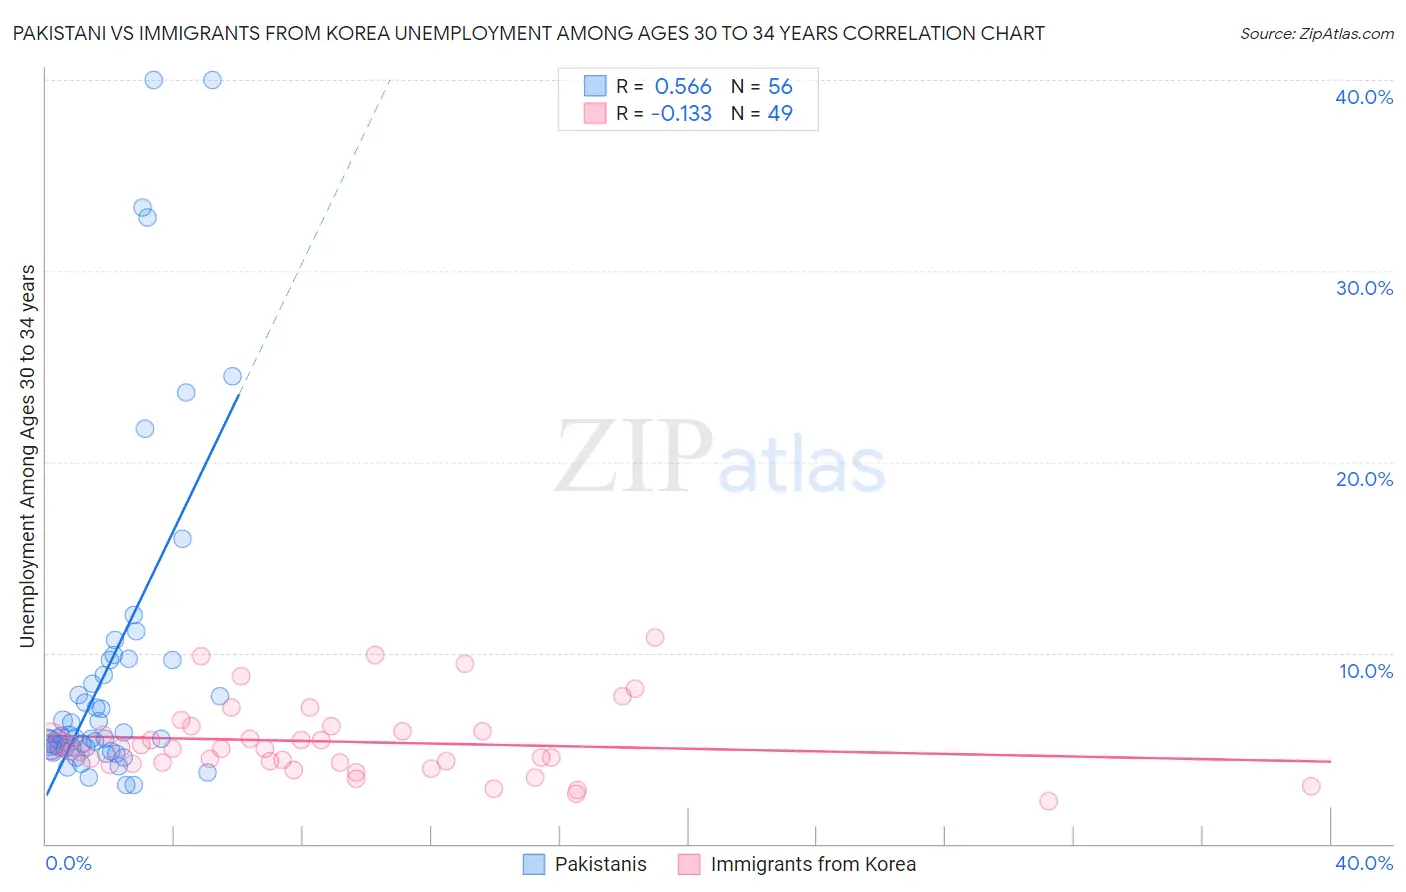
Pakistani vs Immigrants from Korea Unemployment Among Ages 30 to 34 years Correlation Chart
The statistical analysis conducted on geographies consisting of 320,853,803 people shows a substantial positive correlation between the proportion of Pakistanis and unemployment rate among population between the ages 30 and 34 in the United States with a correlation coefficient (R) of 0.566 and weighted average of 5.4%. Similarly, the statistical analysis conducted on geographies consisting of 390,390,260 people shows a poor negative correlation between the proportion of Immigrants from Korea and unemployment rate among population between the ages 30 and 34 in the United States with a correlation coefficient (R) of -0.133 and weighted average of 5.2%, a difference of 3.1%.
Unemployment Among Ages 30 to 34 years Correlation Summary
| Measurement | Pakistani | Immigrants from Korea |
| Minimum | 3.1% | 2.2% |
| Maximum | 40.0% | 10.8% |
| Range | 36.9% | 8.6% |
| Mean | 9.4% | 5.3% |
| Median | 5.6% | 5.0% |
| Interquartile 25% (IQ1) | 5.0% | 4.2% |
| Interquartile 75% (IQ3) | 9.6% | 6.0% |
| Interquartile Range (IQR) | 4.6% | 1.8% |
| Standard Deviation (Sample) | 8.9% | 2.0% |
| Standard Deviation (Population) | 8.8% | 1.9% |
Similar Demographics by Unemployment Among Ages 30 to 34 years
Demographics Similar to Pakistanis by Unemployment Among Ages 30 to 34 years
In terms of unemployment among ages 30 to 34 years, the demographic groups most similar to Pakistanis are Immigrants from Canada (5.4%, a difference of 0.0%), Palestinian (5.4%, a difference of 0.050%), Serbian (5.4%, a difference of 0.16%), Bangladeshi (5.3%, a difference of 0.19%), and Lithuanian (5.4%, a difference of 0.20%).
| Demographics | Rating | Rank | Unemployment Among Ages 30 to 34 years |
| Poles | 78.8 /100 | #129 | Good 5.3% |
| Germans | 77.8 /100 | #130 | Good 5.3% |
| Immigrants | Eastern Europe | 77.4 /100 | #131 | Good 5.3% |
| Carpatho Rusyns | 77.3 /100 | #132 | Good 5.3% |
| Immigrants | Northern Europe | 77.3 /100 | #133 | Good 5.3% |
| Bangladeshis | 76.6 /100 | #134 | Good 5.3% |
| Palestinians | 75.1 /100 | #135 | Good 5.4% |
| Pakistanis | 74.6 /100 | #136 | Good 5.4% |
| Immigrants | Canada | 74.6 /100 | #137 | Good 5.4% |
| Serbians | 72.9 /100 | #138 | Good 5.4% |
| Lithuanians | 72.4 /100 | #139 | Good 5.4% |
| Immigrants | North America | 72.2 /100 | #140 | Good 5.4% |
| Immigrants | Europe | 72.1 /100 | #141 | Good 5.4% |
| Immigrants | Greece | 72.0 /100 | #142 | Good 5.4% |
| Russians | 71.1 /100 | #143 | Good 5.4% |
Demographics Similar to Immigrants from Korea by Unemployment Among Ages 30 to 34 years
In terms of unemployment among ages 30 to 34 years, the demographic groups most similar to Immigrants from Korea are Immigrants from Latvia (5.2%, a difference of 0.030%), Immigrants from Uganda (5.2%, a difference of 0.050%), Immigrants from Egypt (5.2%, a difference of 0.080%), Chilean (5.2%, a difference of 0.11%), and Immigrants from Australia (5.2%, a difference of 0.19%).
| Demographics | Rating | Rank | Unemployment Among Ages 30 to 34 years |
| Scandinavians | 95.6 /100 | #76 | Exceptional 5.2% |
| Uruguayans | 95.4 /100 | #77 | Exceptional 5.2% |
| Indonesians | 95.1 /100 | #78 | Exceptional 5.2% |
| Immigrants | Lithuania | 95.0 /100 | #79 | Exceptional 5.2% |
| Immigrants | Indonesia | 94.7 /100 | #80 | Exceptional 5.2% |
| Chileans | 94.4 /100 | #81 | Exceptional 5.2% |
| Immigrants | Latvia | 94.2 /100 | #82 | Exceptional 5.2% |
| Immigrants | Korea | 94.1 /100 | #83 | Exceptional 5.2% |
| Immigrants | Uganda | 94.0 /100 | #84 | Exceptional 5.2% |
| Immigrants | Egypt | 93.9 /100 | #85 | Exceptional 5.2% |
| Immigrants | Australia | 93.5 /100 | #86 | Exceptional 5.2% |
| Bhutanese | 93.5 /100 | #87 | Exceptional 5.2% |
| Immigrants | Kenya | 93.3 /100 | #88 | Exceptional 5.2% |
| Immigrants | Sweden | 93.3 /100 | #89 | Exceptional 5.2% |
| Immigrants | Romania | 92.8 /100 | #90 | Exceptional 5.2% |