Immigrants from Eastern Asia vs Yugoslavian Unemployment Among Ages 30 to 34 years
COMPARE
Immigrants from Eastern Asia
Yugoslavian
Unemployment Among Ages 30 to 34 years
Unemployment Among Ages 30 to 34 years Comparison
Immigrants from Eastern Asia
Yugoslavians
5.1%
UNEMPLOYMENT AMONG AGES 30 TO 34 YEARS
96.9/ 100
METRIC RATING
64th/ 347
METRIC RANK
5.1%
UNEMPLOYMENT AMONG AGES 30 TO 34 YEARS
98.6/ 100
METRIC RATING
45th/ 347
METRIC RANK
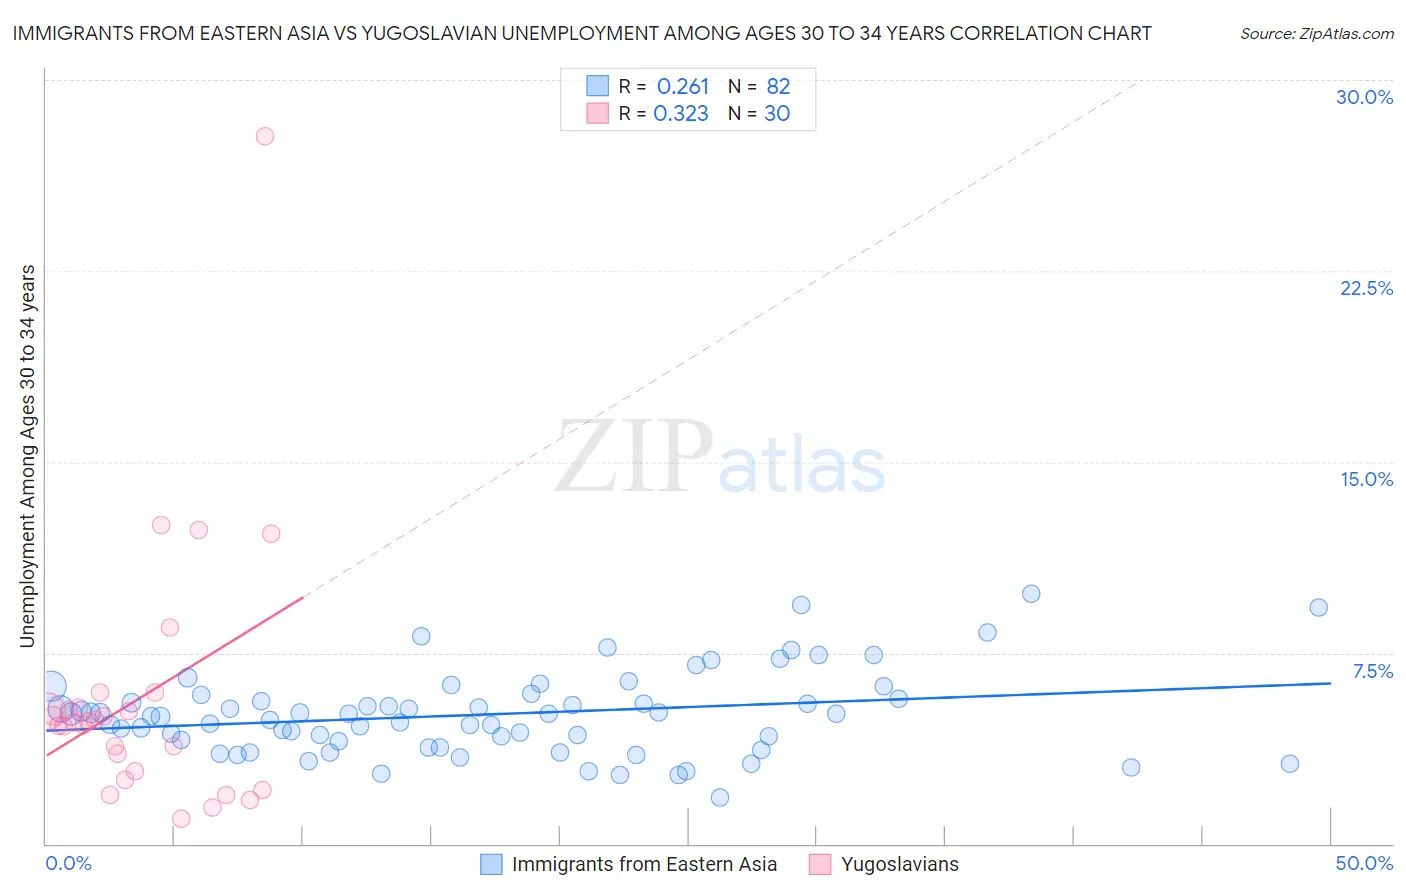
Immigrants from Eastern Asia vs Yugoslavian Unemployment Among Ages 30 to 34 years Correlation Chart
The statistical analysis conducted on geographies consisting of 457,725,166 people shows a weak positive correlation between the proportion of Immigrants from Eastern Asia and unemployment rate among population between the ages 30 and 34 in the United States with a correlation coefficient (R) of 0.261 and weighted average of 5.1%. Similarly, the statistical analysis conducted on geographies consisting of 272,496,305 people shows a mild positive correlation between the proportion of Yugoslavians and unemployment rate among population between the ages 30 and 34 in the United States with a correlation coefficient (R) of 0.323 and weighted average of 5.1%, a difference of 1.6%.
Unemployment Among Ages 30 to 34 years Correlation Summary
| Measurement | Immigrants from Eastern Asia | Yugoslavian |
| Minimum | 1.8% | 1.0% |
| Maximum | 9.8% | 27.8% |
| Range | 8.0% | 26.8% |
| Mean | 5.1% | 5.7% |
| Median | 5.1% | 4.8% |
| Interquartile 25% (IQ1) | 4.0% | 2.9% |
| Interquartile 75% (IQ3) | 5.7% | 5.3% |
| Interquartile Range (IQR) | 1.7% | 2.5% |
| Standard Deviation (Sample) | 1.6% | 5.1% |
| Standard Deviation (Population) | 1.6% | 5.0% |
Demographics Similar to Immigrants from Eastern Asia and Yugoslavians by Unemployment Among Ages 30 to 34 years
In terms of unemployment among ages 30 to 34 years, the demographic groups most similar to Immigrants from Eastern Asia are Belgian (5.1%, a difference of 0.020%), Immigrants from France (5.1%, a difference of 0.030%), Indian (Asian) (5.1%, a difference of 0.050%), Immigrants from Somalia (5.1%, a difference of 0.080%), and Swedish (5.1%, a difference of 0.090%). Similarly, the demographic groups most similar to Yugoslavians are Immigrants from Belgium (5.1%, a difference of 0.030%), Immigrants from Congo (5.1%, a difference of 0.30%), Cypriot (5.1%, a difference of 0.33%), Assyrian/Chaldean/Syriac (5.1%, a difference of 0.35%), and Immigrants from Malaysia (5.1%, a difference of 0.47%).
| Demographics | Rating | Rank | Unemployment Among Ages 30 to 34 years |
| Immigrants | Belgium | 98.7 /100 | #44 | Exceptional 5.1% |
| Yugoslavians | 98.6 /100 | #45 | Exceptional 5.1% |
| Immigrants | Congo | 98.4 /100 | #46 | Exceptional 5.1% |
| Cypriots | 98.4 /100 | #47 | Exceptional 5.1% |
| Assyrians/Chaldeans/Syriacs | 98.4 /100 | #48 | Exceptional 5.1% |
| Immigrants | Malaysia | 98.3 /100 | #49 | Exceptional 5.1% |
| Puget Sound Salish | 98.2 /100 | #50 | Exceptional 5.1% |
| Turks | 98.2 /100 | #51 | Exceptional 5.1% |
| Immigrants | Burma/Myanmar | 98.1 /100 | #52 | Exceptional 5.1% |
| Cubans | 98.1 /100 | #53 | Exceptional 5.1% |
| Immigrants | Morocco | 97.9 /100 | #54 | Exceptional 5.1% |
| Chinese | 97.7 /100 | #55 | Exceptional 5.1% |
| Immigrants | Serbia | 97.4 /100 | #56 | Exceptional 5.1% |
| Immigrants | China | 97.2 /100 | #57 | Exceptional 5.1% |
| Asians | 97.2 /100 | #58 | Exceptional 5.1% |
| Swedes | 97.1 /100 | #59 | Exceptional 5.1% |
| Immigrants | Somalia | 97.1 /100 | #60 | Exceptional 5.1% |
| Indians (Asian) | 97.0 /100 | #61 | Exceptional 5.1% |
| Immigrants | France | 97.0 /100 | #62 | Exceptional 5.1% |
| Belgians | 97.0 /100 | #63 | Exceptional 5.1% |
| Immigrants | Eastern Asia | 96.9 /100 | #64 | Exceptional 5.1% |