Immigrants from Eastern Africa vs Immigrants from South Eastern Asia Male Unemployment
COMPARE
Immigrants from Eastern Africa
Immigrants from South Eastern Asia
Male Unemployment
Male Unemployment Comparison
Immigrants from Eastern Africa
Immigrants from South Eastern Asia
5.2%
MALE UNEMPLOYMENT
79.8/ 100
METRIC RATING
137th/ 347
METRIC RANK
5.4%
MALE UNEMPLOYMENT
28.2/ 100
METRIC RATING
191st/ 347
METRIC RANK
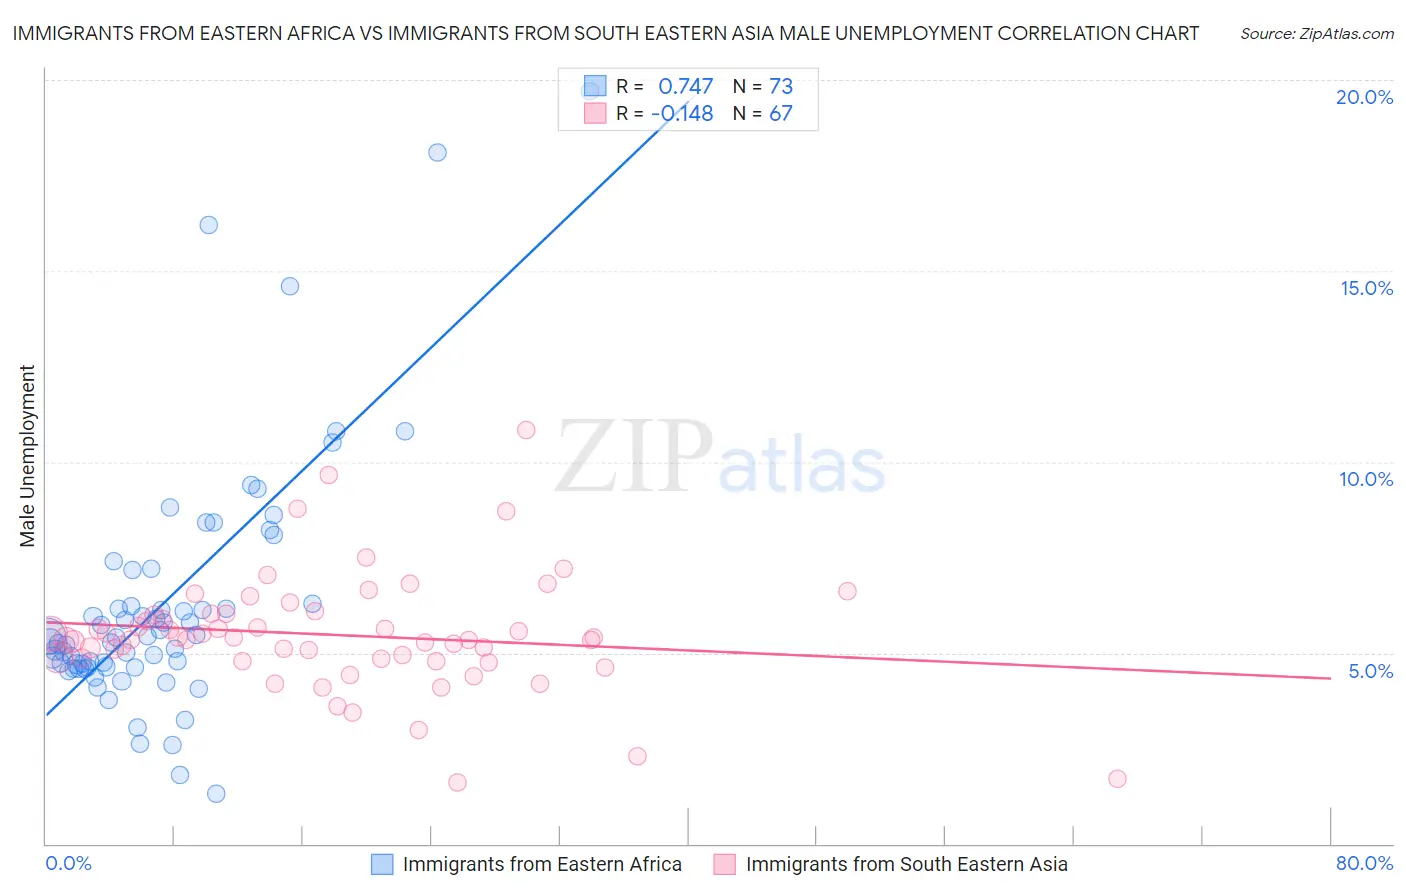
Immigrants from Eastern Africa vs Immigrants from South Eastern Asia Male Unemployment Correlation Chart
The statistical analysis conducted on geographies consisting of 354,168,433 people shows a strong positive correlation between the proportion of Immigrants from Eastern Africa and unemployment rate among males in the United States with a correlation coefficient (R) of 0.747 and weighted average of 5.2%. Similarly, the statistical analysis conducted on geographies consisting of 508,417,377 people shows a poor negative correlation between the proportion of Immigrants from South Eastern Asia and unemployment rate among males in the United States with a correlation coefficient (R) of -0.148 and weighted average of 5.4%, a difference of 3.4%.
Male Unemployment Correlation Summary
| Measurement | Immigrants from Eastern Africa | Immigrants from South Eastern Asia |
| Minimum | 1.3% | 1.6% |
| Maximum | 19.7% | 10.8% |
| Range | 18.4% | 9.2% |
| Mean | 6.3% | 5.5% |
| Median | 5.4% | 5.3% |
| Interquartile 25% (IQ1) | 4.6% | 4.9% |
| Interquartile 75% (IQ3) | 6.7% | 6.0% |
| Interquartile Range (IQR) | 2.1% | 1.2% |
| Standard Deviation (Sample) | 3.3% | 1.5% |
| Standard Deviation (Population) | 3.2% | 1.5% |
Similar Demographics by Male Unemployment
Demographics Similar to Immigrants from Eastern Africa by Male Unemployment
In terms of male unemployment, the demographic groups most similar to Immigrants from Eastern Africa are Lebanese (5.2%, a difference of 0.010%), Immigrants from Croatia (5.2%, a difference of 0.010%), Immigrants from Saudi Arabia (5.2%, a difference of 0.030%), Kenyan (5.2%, a difference of 0.030%), and Brazilian (5.2%, a difference of 0.040%).
| Demographics | Rating | Rank | Male Unemployment |
| Immigrants | Malaysia | 83.5 /100 | #130 | Excellent 5.2% |
| Immigrants | Germany | 83.0 /100 | #131 | Excellent 5.2% |
| Chickasaw | 82.9 /100 | #132 | Excellent 5.2% |
| Colombians | 81.1 /100 | #133 | Excellent 5.2% |
| Pakistanis | 80.5 /100 | #134 | Excellent 5.2% |
| Immigrants | Saudi Arabia | 80.1 /100 | #135 | Excellent 5.2% |
| Lebanese | 79.9 /100 | #136 | Good 5.2% |
| Immigrants | Eastern Africa | 79.8 /100 | #137 | Good 5.2% |
| Immigrants | Croatia | 79.7 /100 | #138 | Good 5.2% |
| Kenyans | 79.4 /100 | #139 | Good 5.2% |
| Brazilians | 79.3 /100 | #140 | Good 5.2% |
| Immigrants | Switzerland | 79.2 /100 | #141 | Good 5.2% |
| Fijians | 78.3 /100 | #142 | Good 5.2% |
| Syrians | 78.0 /100 | #143 | Good 5.2% |
| Sri Lankans | 77.9 /100 | #144 | Good 5.2% |
Demographics Similar to Immigrants from South Eastern Asia by Male Unemployment
In terms of male unemployment, the demographic groups most similar to Immigrants from South Eastern Asia are Immigrants from Uganda (5.4%, a difference of 0.040%), Immigrants from South America (5.4%, a difference of 0.080%), Arab (5.4%, a difference of 0.14%), Immigrants from Belarus (5.4%, a difference of 0.16%), and Costa Rican (5.4%, a difference of 0.21%).
| Demographics | Rating | Rank | Male Unemployment |
| Spaniards | 35.1 /100 | #184 | Fair 5.3% |
| Koreans | 34.9 /100 | #185 | Fair 5.3% |
| Iraqis | 31.6 /100 | #186 | Fair 5.4% |
| Costa Ricans | 31.3 /100 | #187 | Fair 5.4% |
| Arabs | 30.2 /100 | #188 | Fair 5.4% |
| Immigrants | South America | 29.4 /100 | #189 | Fair 5.4% |
| Immigrants | Uganda | 28.8 /100 | #190 | Fair 5.4% |
| Immigrants | South Eastern Asia | 28.2 /100 | #191 | Fair 5.4% |
| Immigrants | Belarus | 26.0 /100 | #192 | Fair 5.4% |
| Immigrants | Israel | 25.2 /100 | #193 | Fair 5.4% |
| Spanish | 19.7 /100 | #194 | Poor 5.4% |
| Immigrants | Southern Europe | 17.7 /100 | #195 | Poor 5.4% |
| Albanians | 17.3 /100 | #196 | Poor 5.4% |
| Alsatians | 16.7 /100 | #197 | Poor 5.4% |
| Immigrants | Thailand | 14.7 /100 | #198 | Poor 5.4% |