Immigrants from Dominican Republic vs Immigrants from Bahamas Unemployment Among Youth under 25 years
COMPARE
Immigrants from Dominican Republic
Immigrants from Bahamas
Unemployment Among Youth under 25 years
Unemployment Among Youth under 25 years Comparison
Immigrants from Dominican Republic
Immigrants from Bahamas
15.6%
UNEMPLOYMENT AMONG YOUTH UNDER 25 YEARS
0.0/ 100
METRIC RATING
328th/ 347
METRIC RANK
12.9%
UNEMPLOYMENT AMONG YOUTH UNDER 25 YEARS
0.0/ 100
METRIC RATING
271st/ 347
METRIC RANK
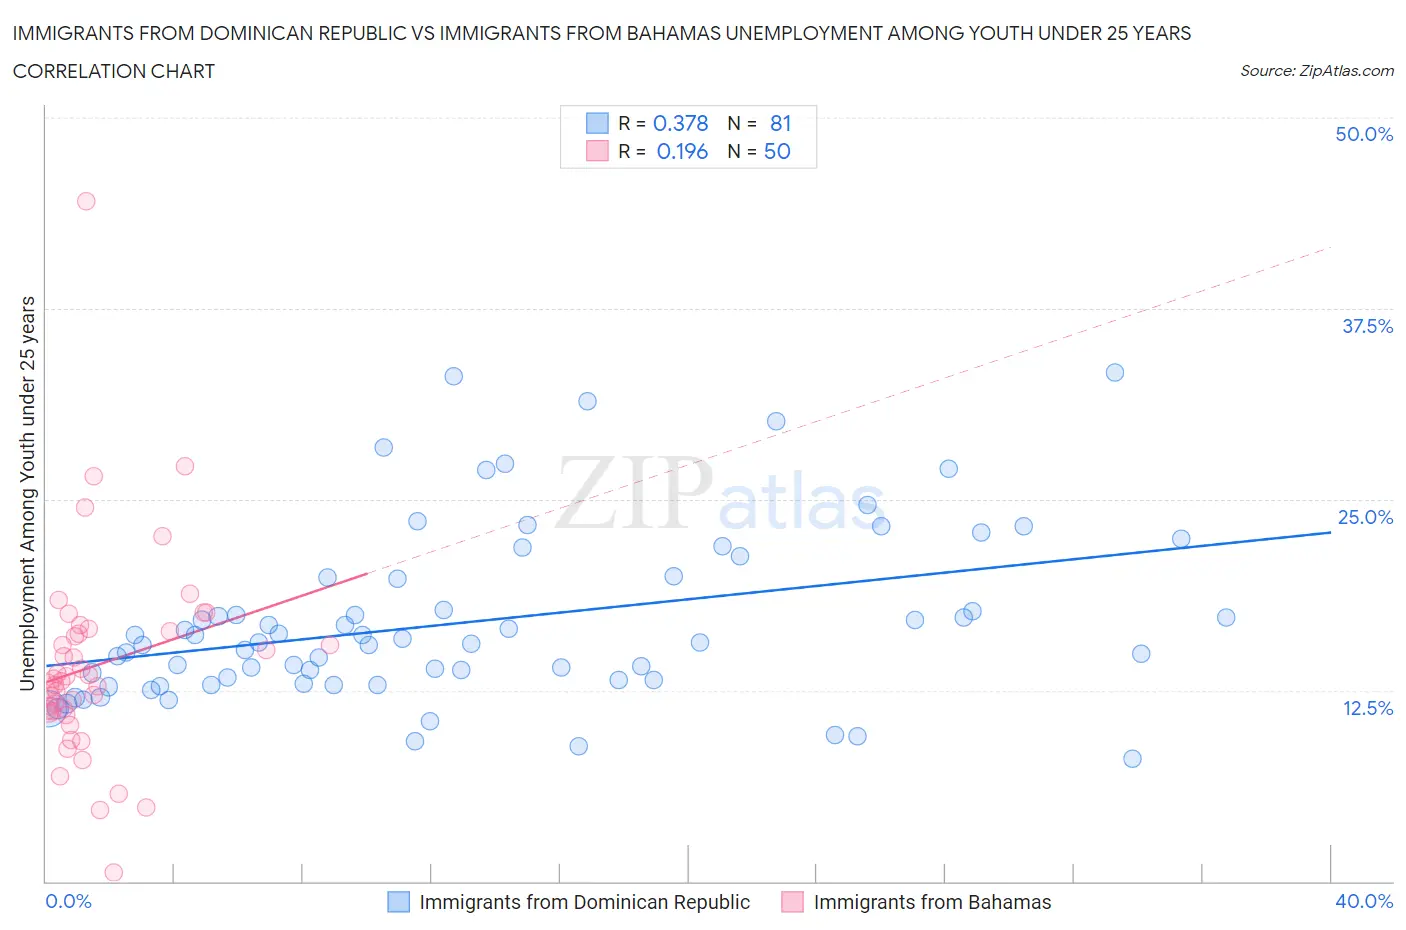
Immigrants from Dominican Republic vs Immigrants from Bahamas Unemployment Among Youth under 25 years Correlation Chart
The statistical analysis conducted on geographies consisting of 272,581,719 people shows a mild positive correlation between the proportion of Immigrants from Dominican Republic and unemployment rate among youth under the age of 25 in the United States with a correlation coefficient (R) of 0.378 and weighted average of 15.6%. Similarly, the statistical analysis conducted on geographies consisting of 104,451,024 people shows a poor positive correlation between the proportion of Immigrants from Bahamas and unemployment rate among youth under the age of 25 in the United States with a correlation coefficient (R) of 0.196 and weighted average of 12.9%, a difference of 20.8%.
Unemployment Among Youth under 25 years Correlation Summary
| Measurement | Immigrants from Dominican Republic | Immigrants from Bahamas |
| Minimum | 8.0% | 0.60% |
| Maximum | 33.3% | 44.5% |
| Range | 25.3% | 43.9% |
| Mean | 17.0% | 14.1% |
| Median | 15.6% | 13.2% |
| Interquartile 25% (IQ1) | 13.1% | 11.1% |
| Interquartile 75% (IQ3) | 19.9% | 16.4% |
| Interquartile Range (IQR) | 6.8% | 5.3% |
| Standard Deviation (Sample) | 5.7% | 6.7% |
| Standard Deviation (Population) | 5.6% | 6.7% |
Similar Demographics by Unemployment Among Youth under 25 years
Demographics Similar to Immigrants from Dominican Republic by Unemployment Among Youth under 25 years
In terms of unemployment among youth under 25 years, the demographic groups most similar to Immigrants from Dominican Republic are British West Indian (15.5%, a difference of 0.11%), Immigrants from Yemen (15.6%, a difference of 0.13%), Yakama (15.6%, a difference of 0.17%), Dominican (15.7%, a difference of 1.0%), and Immigrants from Grenada (15.8%, a difference of 1.7%).
| Demographics | Rating | Rank | Unemployment Among Youth under 25 years |
| Cheyenne | 0.0 /100 | #321 | Tragic 14.6% |
| Trinidadians and Tobagonians | 0.0 /100 | #322 | Tragic 14.6% |
| Immigrants | Trinidad and Tobago | 0.0 /100 | #323 | Tragic 14.6% |
| Immigrants | Jamaica | 0.0 /100 | #324 | Tragic 14.8% |
| Alaska Natives | 0.0 /100 | #325 | Tragic 14.9% |
| Immigrants | Barbados | 0.0 /100 | #326 | Tragic 15.2% |
| British West Indians | 0.0 /100 | #327 | Tragic 15.5% |
| Immigrants | Dominican Republic | 0.0 /100 | #328 | Tragic 15.6% |
| Immigrants | Yemen | 0.0 /100 | #329 | Tragic 15.6% |
| Yakama | 0.0 /100 | #330 | Tragic 15.6% |
| Dominicans | 0.0 /100 | #331 | Tragic 15.7% |
| Immigrants | Grenada | 0.0 /100 | #332 | Tragic 15.8% |
| Guyanese | 0.0 /100 | #333 | Tragic 15.9% |
| Immigrants | Guyana | 0.0 /100 | #334 | Tragic 15.9% |
| Immigrants | St. Vincent and the Grenadines | 0.0 /100 | #335 | Tragic 16.1% |
Demographics Similar to Immigrants from Bahamas by Unemployment Among Youth under 25 years
In terms of unemployment among youth under 25 years, the demographic groups most similar to Immigrants from Bahamas are Cape Verdean (12.9%, a difference of 0.22%), Immigrants from Liberia (12.8%, a difference of 0.53%), Nigerian (13.0%, a difference of 0.57%), Immigrants from Nigeria (13.0%, a difference of 1.1%), and Bermudan (13.0%, a difference of 1.3%).
| Demographics | Rating | Rank | Unemployment Among Youth under 25 years |
| Puget Sound Salish | 0.1 /100 | #264 | Tragic 12.5% |
| Nepalese | 0.0 /100 | #265 | Tragic 12.5% |
| Immigrants | Latin America | 0.0 /100 | #266 | Tragic 12.6% |
| Sub-Saharan Africans | 0.0 /100 | #267 | Tragic 12.6% |
| Tlingit-Haida | 0.0 /100 | #268 | Tragic 12.7% |
| Kiowa | 0.0 /100 | #269 | Tragic 12.7% |
| Immigrants | Liberia | 0.0 /100 | #270 | Tragic 12.8% |
| Immigrants | Bahamas | 0.0 /100 | #271 | Tragic 12.9% |
| Cape Verdeans | 0.0 /100 | #272 | Tragic 12.9% |
| Nigerians | 0.0 /100 | #273 | Tragic 13.0% |
| Immigrants | Nigeria | 0.0 /100 | #274 | Tragic 13.0% |
| Bermudans | 0.0 /100 | #275 | Tragic 13.0% |
| Immigrants | Uzbekistan | 0.0 /100 | #276 | Tragic 13.1% |
| Bahamians | 0.0 /100 | #277 | Tragic 13.1% |
| Africans | 0.0 /100 | #278 | Tragic 13.2% |