Immigrants from Dominica vs Immigrants from Lebanon Unemployment Among Women with Children Under 6 years
COMPARE
Immigrants from Dominica
Immigrants from Lebanon
Unemployment Among Women with Children Under 6 years
Unemployment Among Women with Children Under 6 years Comparison
Immigrants from Dominica
Immigrants from Lebanon
8.6%
UNEMPLOYMENT AMONG WOMEN WITH CHILDREN UNDER 6 YEARS
0.0/ 100
METRIC RATING
278th/ 347
METRIC RANK
7.9%
UNEMPLOYMENT AMONG WOMEN WITH CHILDREN UNDER 6 YEARS
11.1/ 100
METRIC RATING
216th/ 347
METRIC RANK
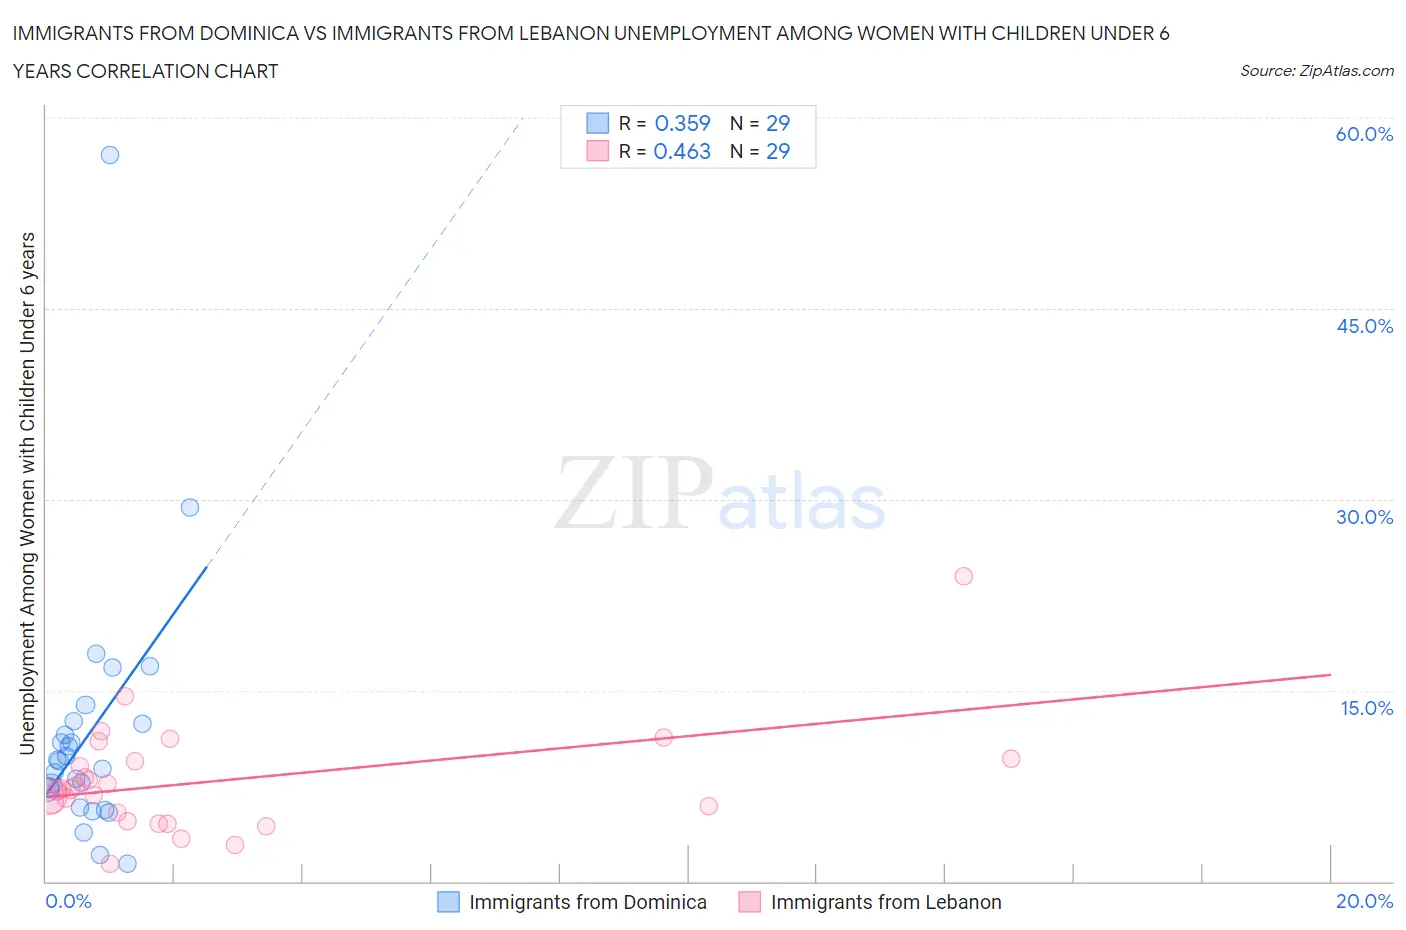
Immigrants from Dominica vs Immigrants from Lebanon Unemployment Among Women with Children Under 6 years Correlation Chart
The statistical analysis conducted on geographies consisting of 77,270,473 people shows a mild positive correlation between the proportion of Immigrants from Dominica and unemployment rate among women with children under the age of 6 in the United States with a correlation coefficient (R) of 0.359 and weighted average of 8.6%. Similarly, the statistical analysis conducted on geographies consisting of 182,697,940 people shows a moderate positive correlation between the proportion of Immigrants from Lebanon and unemployment rate among women with children under the age of 6 in the United States with a correlation coefficient (R) of 0.463 and weighted average of 7.9%, a difference of 9.3%.
Unemployment Among Women with Children Under 6 years Correlation Summary
| Measurement | Immigrants from Dominica | Immigrants from Lebanon |
| Minimum | 1.4% | 1.3% |
| Maximum | 57.1% | 24.0% |
| Range | 55.7% | 22.7% |
| Mean | 11.5% | 7.9% |
| Median | 9.4% | 7.2% |
| Interquartile 25% (IQ1) | 6.5% | 5.1% |
| Interquartile 75% (IQ3) | 12.5% | 9.5% |
| Interquartile Range (IQR) | 6.0% | 4.4% |
| Standard Deviation (Sample) | 10.4% | 4.3% |
| Standard Deviation (Population) | 10.2% | 4.2% |
Similar Demographics by Unemployment Among Women with Children Under 6 years
Demographics Similar to Immigrants from Dominica by Unemployment Among Women with Children Under 6 years
In terms of unemployment among women with children under 6 years, the demographic groups most similar to Immigrants from Dominica are Immigrants from Guatemala (8.6%, a difference of 0.010%), Immigrants from Belize (8.6%, a difference of 0.050%), Guatemalan (8.7%, a difference of 0.18%), Bermudan (8.7%, a difference of 0.27%), and Haitian (8.6%, a difference of 0.28%).
| Demographics | Rating | Rank | Unemployment Among Women with Children Under 6 years |
| Immigrants | Congo | 0.2 /100 | #271 | Tragic 8.5% |
| Mexican American Indians | 0.1 /100 | #272 | Tragic 8.5% |
| Slovaks | 0.1 /100 | #273 | Tragic 8.5% |
| Immigrants | Cameroon | 0.1 /100 | #274 | Tragic 8.6% |
| Immigrants | Latin America | 0.1 /100 | #275 | Tragic 8.6% |
| Yaqui | 0.0 /100 | #276 | Tragic 8.6% |
| Haitians | 0.0 /100 | #277 | Tragic 8.6% |
| Immigrants | Dominica | 0.0 /100 | #278 | Tragic 8.6% |
| Immigrants | Guatemala | 0.0 /100 | #279 | Tragic 8.6% |
| Immigrants | Belize | 0.0 /100 | #280 | Tragic 8.6% |
| Guatemalans | 0.0 /100 | #281 | Tragic 8.7% |
| Bermudans | 0.0 /100 | #282 | Tragic 8.7% |
| Spanish American Indians | 0.0 /100 | #283 | Tragic 8.7% |
| Blackfeet | 0.0 /100 | #284 | Tragic 8.7% |
| U.S. Virgin Islanders | 0.0 /100 | #285 | Tragic 8.7% |
Demographics Similar to Immigrants from Lebanon by Unemployment Among Women with Children Under 6 years
In terms of unemployment among women with children under 6 years, the demographic groups most similar to Immigrants from Lebanon are Ecuadorian (7.9%, a difference of 0.020%), Spanish (7.9%, a difference of 0.030%), Scottish (7.9%, a difference of 0.050%), Immigrants from Nigeria (7.9%, a difference of 0.12%), and Swiss (7.9%, a difference of 0.19%).
| Demographics | Rating | Rank | Unemployment Among Women with Children Under 6 years |
| Costa Ricans | 17.6 /100 | #209 | Poor 7.8% |
| Poles | 16.0 /100 | #210 | Poor 7.9% |
| Immigrants | Ecuador | 14.9 /100 | #211 | Poor 7.9% |
| Swiss | 12.3 /100 | #212 | Poor 7.9% |
| Scottish | 11.4 /100 | #213 | Poor 7.9% |
| Spanish | 11.3 /100 | #214 | Poor 7.9% |
| Ecuadorians | 11.2 /100 | #215 | Poor 7.9% |
| Immigrants | Lebanon | 11.1 /100 | #216 | Poor 7.9% |
| Immigrants | Nigeria | 10.3 /100 | #217 | Poor 7.9% |
| Moroccans | 9.7 /100 | #218 | Tragic 7.9% |
| Arabs | 9.4 /100 | #219 | Tragic 7.9% |
| South American Indians | 9.3 /100 | #220 | Tragic 7.9% |
| Immigrants | Germany | 8.5 /100 | #221 | Tragic 7.9% |
| Samoans | 8.4 /100 | #222 | Tragic 7.9% |
| Carpatho Rusyns | 7.8 /100 | #223 | Tragic 8.0% |