Immigrants from Dominica vs Immigrants from Costa Rica Male Unemployment
COMPARE
Immigrants from Dominica
Immigrants from Costa Rica
Male Unemployment
Male Unemployment Comparison
Immigrants from Dominica
Immigrants from Costa Rica
7.0%
MALE UNEMPLOYMENT
0.0/ 100
METRIC RATING
313th/ 347
METRIC RANK
5.5%
MALE UNEMPLOYMENT
11.4/ 100
METRIC RATING
205th/ 347
METRIC RANK
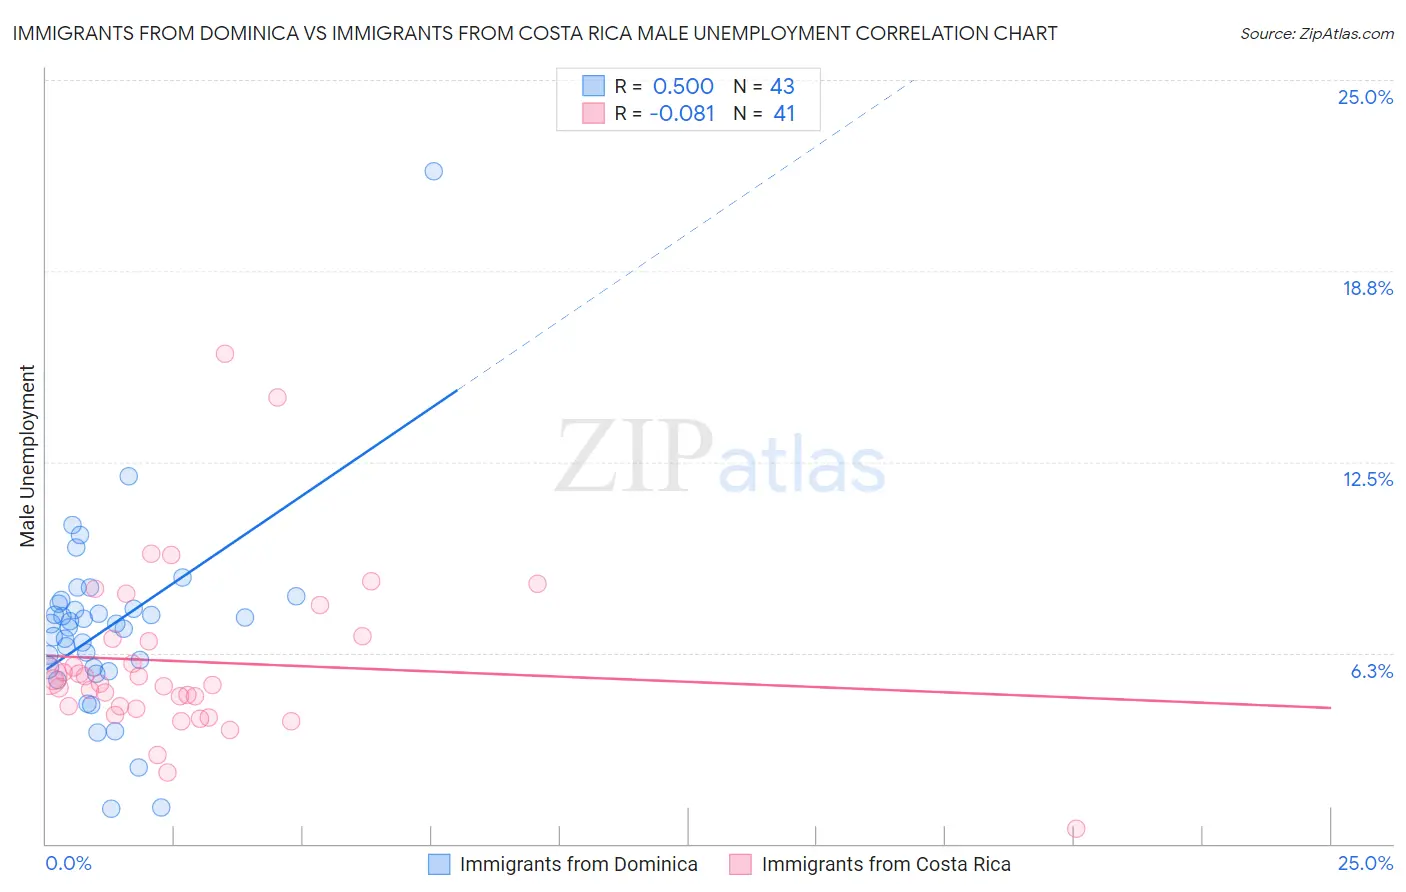
Immigrants from Dominica vs Immigrants from Costa Rica Male Unemployment Correlation Chart
The statistical analysis conducted on geographies consisting of 83,742,223 people shows a moderate positive correlation between the proportion of Immigrants from Dominica and unemployment rate among males in the United States with a correlation coefficient (R) of 0.500 and weighted average of 7.0%. Similarly, the statistical analysis conducted on geographies consisting of 204,074,959 people shows a slight negative correlation between the proportion of Immigrants from Costa Rica and unemployment rate among males in the United States with a correlation coefficient (R) of -0.081 and weighted average of 5.5%, a difference of 28.5%.
Male Unemployment Correlation Summary
| Measurement | Immigrants from Dominica | Immigrants from Costa Rica |
| Minimum | 1.2% | 0.50% |
| Maximum | 22.0% | 16.0% |
| Range | 20.8% | 15.5% |
| Mean | 7.1% | 6.0% |
| Median | 7.2% | 5.3% |
| Interquartile 25% (IQ1) | 5.8% | 4.5% |
| Interquartile 75% (IQ3) | 7.9% | 6.8% |
| Interquartile Range (IQR) | 2.1% | 2.3% |
| Standard Deviation (Sample) | 3.2% | 2.8% |
| Standard Deviation (Population) | 3.1% | 2.8% |
Similar Demographics by Male Unemployment
Demographics Similar to Immigrants from Dominica by Male Unemployment
In terms of male unemployment, the demographic groups most similar to Immigrants from Dominica are Lumbee (6.9%, a difference of 1.0%), Immigrants from Armenia (6.9%, a difference of 1.2%), Immigrants from Barbados (7.1%, a difference of 1.3%), Houma (7.1%, a difference of 1.5%), and Immigrants from Guyana (7.1%, a difference of 1.5%).
| Demographics | Rating | Rank | Male Unemployment |
| Immigrants | Trinidad and Tobago | 0.0 /100 | #306 | Tragic 6.7% |
| Immigrants | Jamaica | 0.0 /100 | #307 | Tragic 6.7% |
| Aleuts | 0.0 /100 | #308 | Tragic 6.8% |
| Barbadians | 0.0 /100 | #309 | Tragic 6.9% |
| Blacks/African Americans | 0.0 /100 | #310 | Tragic 6.9% |
| Immigrants | Armenia | 0.0 /100 | #311 | Tragic 6.9% |
| Lumbee | 0.0 /100 | #312 | Tragic 6.9% |
| Immigrants | Dominica | 0.0 /100 | #313 | Tragic 7.0% |
| Immigrants | Barbados | 0.0 /100 | #314 | Tragic 7.1% |
| Houma | 0.0 /100 | #315 | Tragic 7.1% |
| Immigrants | Guyana | 0.0 /100 | #316 | Tragic 7.1% |
| Guyanese | 0.0 /100 | #317 | Tragic 7.1% |
| Cape Verdeans | 0.0 /100 | #318 | Tragic 7.1% |
| British West Indians | 0.0 /100 | #319 | Tragic 7.3% |
| Colville | 0.0 /100 | #320 | Tragic 7.4% |
Demographics Similar to Immigrants from Costa Rica by Male Unemployment
In terms of male unemployment, the demographic groups most similar to Immigrants from Costa Rica are Guamanian/Chamorro (5.4%, a difference of 0.13%), Immigrants from Laos (5.4%, a difference of 0.22%), Immigrants from Ukraine (5.5%, a difference of 0.22%), Nonimmigrants (5.4%, a difference of 0.23%), and Immigrants from Philippines (5.4%, a difference of 0.27%).
| Demographics | Rating | Rank | Male Unemployment |
| Immigrants | Thailand | 14.7 /100 | #198 | Poor 5.4% |
| Immigrants | Greece | 14.5 /100 | #199 | Poor 5.4% |
| Immigrants | Zaire | 13.7 /100 | #200 | Poor 5.4% |
| Immigrants | Philippines | 13.5 /100 | #201 | Poor 5.4% |
| Immigrants | Nonimmigrants | 13.1 /100 | #202 | Poor 5.4% |
| Immigrants | Laos | 13.0 /100 | #203 | Poor 5.4% |
| Guamanians/Chamorros | 12.3 /100 | #204 | Poor 5.4% |
| Immigrants | Costa Rica | 11.4 /100 | #205 | Poor 5.5% |
| Immigrants | Ukraine | 9.9 /100 | #206 | Tragic 5.5% |
| Immigrants | Syria | 9.3 /100 | #207 | Tragic 5.5% |
| Immigrants | Lebanon | 8.6 /100 | #208 | Tragic 5.5% |
| Immigrants | Middle Africa | 8.3 /100 | #209 | Tragic 5.5% |
| South American Indians | 7.6 /100 | #210 | Tragic 5.5% |
| Israelis | 7.4 /100 | #211 | Tragic 5.5% |
| Hmong | 7.0 /100 | #212 | Tragic 5.5% |