Immigrants from Switzerland vs Immigrants from Barbados Unemployment
COMPARE
Immigrants from Switzerland
Immigrants from Barbados
Unemployment
Unemployment Comparison
Immigrants from Switzerland
Immigrants from Barbados
5.1%
UNEMPLOYMENT
89.1/ 100
METRIC RATING
122nd/ 347
METRIC RANK
6.6%
UNEMPLOYMENT
0.0/ 100
METRIC RATING
313th/ 347
METRIC RANK
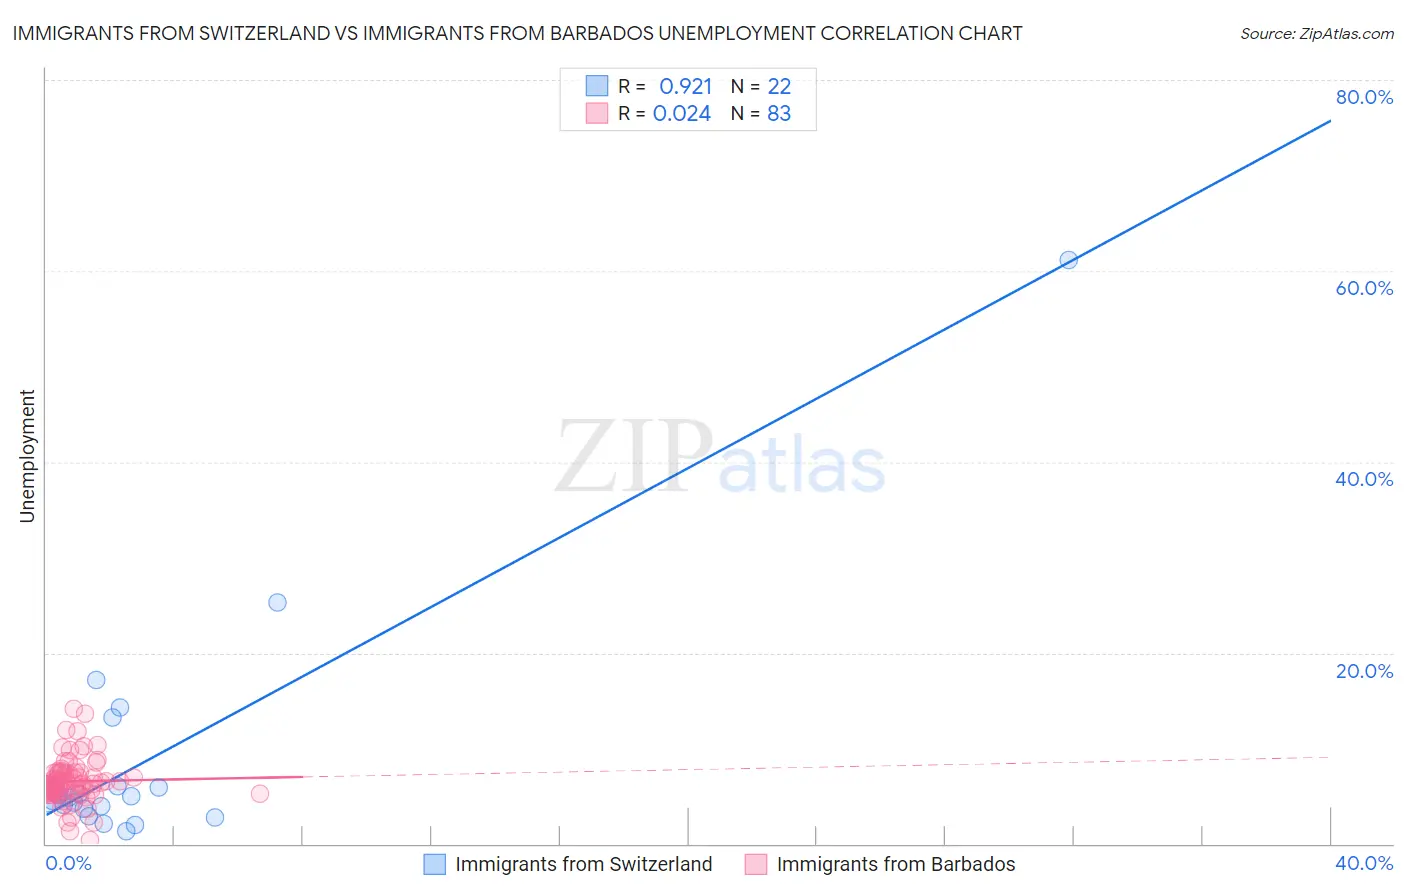
Immigrants from Switzerland vs Immigrants from Barbados Unemployment Correlation Chart
The statistical analysis conducted on geographies consisting of 148,014,633 people shows a near-perfect positive correlation between the proportion of Immigrants from Switzerland and unemployment in the United States with a correlation coefficient (R) of 0.921 and weighted average of 5.1%. Similarly, the statistical analysis conducted on geographies consisting of 112,764,832 people shows no correlation between the proportion of Immigrants from Barbados and unemployment in the United States with a correlation coefficient (R) of 0.024 and weighted average of 6.6%, a difference of 29.6%.
Unemployment Correlation Summary
| Measurement | Immigrants from Switzerland | Immigrants from Barbados |
| Minimum | 1.3% | 0.40% |
| Maximum | 61.1% | 14.2% |
| Range | 59.8% | 13.8% |
| Mean | 9.1% | 6.5% |
| Median | 4.9% | 6.3% |
| Interquartile 25% (IQ1) | 3.6% | 5.4% |
| Interquartile 75% (IQ3) | 6.0% | 7.4% |
| Interquartile Range (IQR) | 2.4% | 2.0% |
| Standard Deviation (Sample) | 13.0% | 2.3% |
| Standard Deviation (Population) | 12.7% | 2.3% |
Similar Demographics by Unemployment
Demographics Similar to Immigrants from Switzerland by Unemployment
In terms of unemployment, the demographic groups most similar to Immigrants from Switzerland are Lebanese (5.1%, a difference of 0.020%), Asian (5.1%, a difference of 0.020%), Ethiopian (5.1%, a difference of 0.080%), Immigrants from France (5.1%, a difference of 0.090%), and Macedonian (5.1%, a difference of 0.090%).
| Demographics | Rating | Rank | Unemployment |
| Immigrants | Western Europe | 91.1 /100 | #115 | Exceptional 5.1% |
| Immigrants | Sri Lanka | 91.1 /100 | #116 | Exceptional 5.1% |
| Immigrants | Malaysia | 91.0 /100 | #117 | Exceptional 5.1% |
| Immigrants | Germany | 90.8 /100 | #118 | Exceptional 5.1% |
| Immigrants | France | 89.7 /100 | #119 | Excellent 5.1% |
| Macedonians | 89.7 /100 | #120 | Excellent 5.1% |
| Lebanese | 89.2 /100 | #121 | Excellent 5.1% |
| Immigrants | Switzerland | 89.1 /100 | #122 | Excellent 5.1% |
| Asians | 89.0 /100 | #123 | Excellent 5.1% |
| Ethiopians | 88.6 /100 | #124 | Excellent 5.1% |
| Immigrants | Eastern Asia | 88.3 /100 | #125 | Excellent 5.1% |
| Kenyans | 88.2 /100 | #126 | Excellent 5.1% |
| Immigrants | Kenya | 88.2 /100 | #127 | Excellent 5.1% |
| Immigrants | Eastern Africa | 88.1 /100 | #128 | Excellent 5.1% |
| Immigrants | Latvia | 88.0 /100 | #129 | Excellent 5.1% |
Demographics Similar to Immigrants from Barbados by Unemployment
In terms of unemployment, the demographic groups most similar to Immigrants from Barbados are Colville (6.6%, a difference of 0.38%), Black/African American (6.6%, a difference of 0.55%), Cape Verdean (6.5%, a difference of 0.95%), Immigrants from Belize (6.5%, a difference of 1.3%), and Houma (6.7%, a difference of 1.3%).
| Demographics | Rating | Rank | Unemployment |
| Lumbee | 0.0 /100 | #306 | Tragic 6.4% |
| Immigrants | Bangladesh | 0.0 /100 | #307 | Tragic 6.5% |
| Barbadians | 0.0 /100 | #308 | Tragic 6.5% |
| Vietnamese | 0.0 /100 | #309 | Tragic 6.5% |
| Immigrants | Belize | 0.0 /100 | #310 | Tragic 6.5% |
| Cape Verdeans | 0.0 /100 | #311 | Tragic 6.5% |
| Colville | 0.0 /100 | #312 | Tragic 6.6% |
| Immigrants | Barbados | 0.0 /100 | #313 | Tragic 6.6% |
| Blacks/African Americans | 0.0 /100 | #314 | Tragic 6.6% |
| Houma | 0.0 /100 | #315 | Tragic 6.7% |
| Immigrants | Dominica | 0.0 /100 | #316 | Tragic 6.7% |
| Shoshone | 0.0 /100 | #317 | Tragic 6.8% |
| Immigrants | Cabo Verde | 0.0 /100 | #318 | Tragic 6.8% |
| British West Indians | 0.0 /100 | #319 | Tragic 6.8% |
| Immigrants | St. Vincent and the Grenadines | 0.0 /100 | #320 | Tragic 6.9% |