Immigrants from Costa Rica vs Luxembourger Unemployment Among Ages 60 to 64 years
COMPARE
Immigrants from Costa Rica
Luxembourger
Unemployment Among Ages 60 to 64 years
Unemployment Among Ages 60 to 64 years Comparison
Immigrants from Costa Rica
Luxembourgers
5.1%
UNEMPLOYMENT AMONG AGES 60 TO 64 YEARS
0.2/ 100
METRIC RATING
269th/ 347
METRIC RANK
4.3%
UNEMPLOYMENT AMONG AGES 60 TO 64 YEARS
100.0/ 100
METRIC RATING
11th/ 347
METRIC RANK
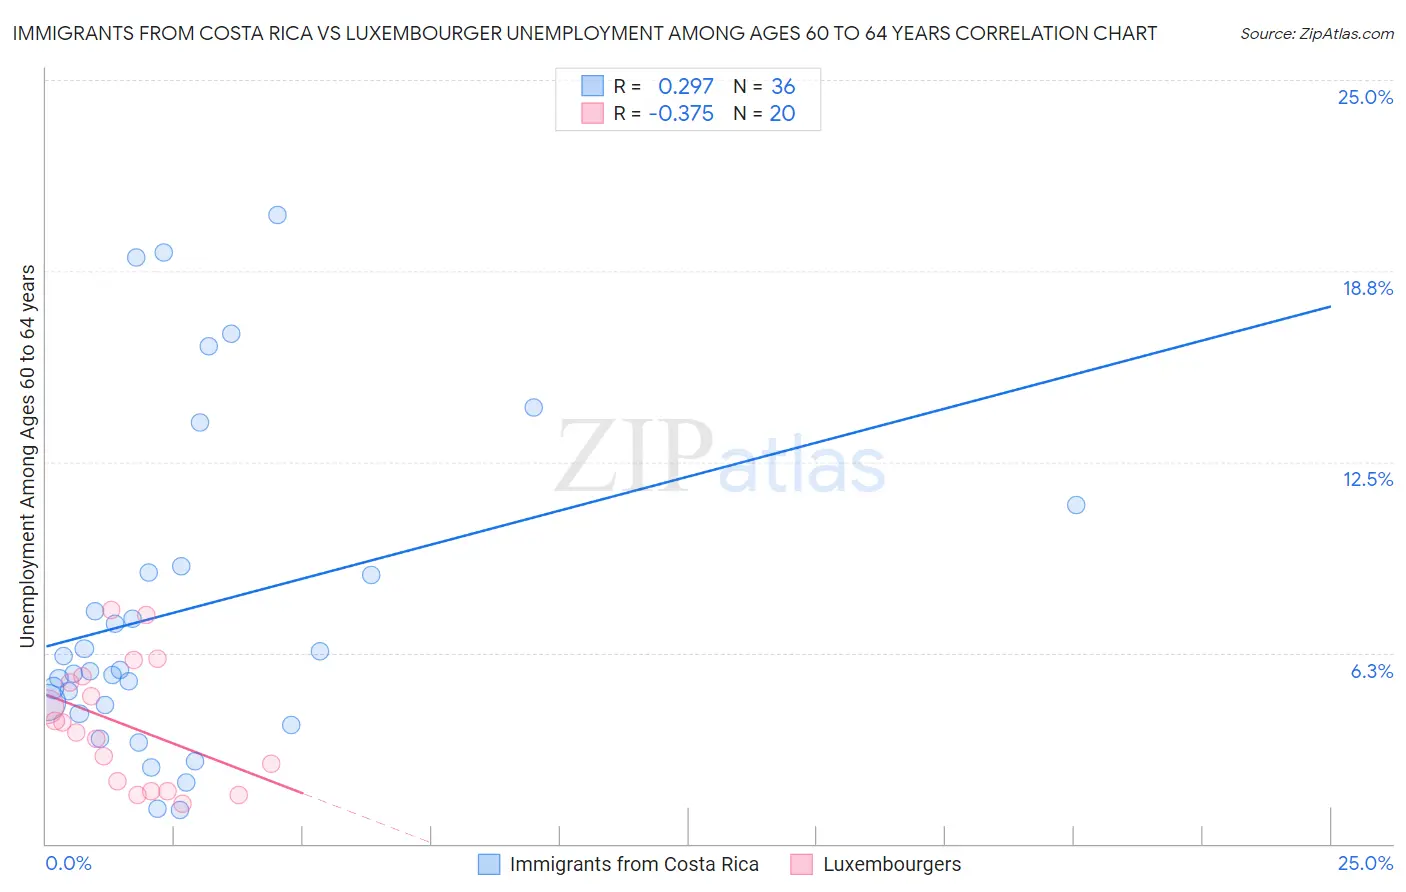
Immigrants from Costa Rica vs Luxembourger Unemployment Among Ages 60 to 64 years Correlation Chart
The statistical analysis conducted on geographies consisting of 195,089,274 people shows a weak positive correlation between the proportion of Immigrants from Costa Rica and unemployment rate among population between the ages 60 and 64 in the United States with a correlation coefficient (R) of 0.297 and weighted average of 5.1%. Similarly, the statistical analysis conducted on geographies consisting of 136,276,430 people shows a mild negative correlation between the proportion of Luxembourgers and unemployment rate among population between the ages 60 and 64 in the United States with a correlation coefficient (R) of -0.375 and weighted average of 4.3%, a difference of 19.9%.
Unemployment Among Ages 60 to 64 years Correlation Summary
| Measurement | Immigrants from Costa Rica | Luxembourger |
| Minimum | 1.1% | 1.3% |
| Maximum | 20.6% | 7.6% |
| Range | 19.5% | 6.3% |
| Mean | 7.7% | 3.9% |
| Median | 5.7% | 3.8% |
| Interquartile 25% (IQ1) | 4.4% | 1.9% |
| Interquartile 75% (IQ3) | 9.0% | 5.4% |
| Interquartile Range (IQR) | 4.6% | 3.5% |
| Standard Deviation (Sample) | 5.3% | 2.0% |
| Standard Deviation (Population) | 5.2% | 1.9% |
Similar Demographics by Unemployment Among Ages 60 to 64 years
Demographics Similar to Immigrants from Costa Rica by Unemployment Among Ages 60 to 64 years
In terms of unemployment among ages 60 to 64 years, the demographic groups most similar to Immigrants from Costa Rica are Central American Indian (5.1%, a difference of 0.040%), Immigrants from Bahamas (5.1%, a difference of 0.20%), Immigrants from Australia (5.1%, a difference of 0.25%), Immigrants from Argentina (5.1%, a difference of 0.27%), and Immigrants from Iran (5.1%, a difference of 0.31%).
| Demographics | Rating | Rank | Unemployment Among Ages 60 to 64 years |
| Immigrants | Uzbekistan | 0.4 /100 | #262 | Tragic 5.1% |
| Immigrants | Immigrants | 0.4 /100 | #263 | Tragic 5.1% |
| Sioux | 0.3 /100 | #264 | Tragic 5.1% |
| Immigrants | Argentina | 0.2 /100 | #265 | Tragic 5.1% |
| Immigrants | Australia | 0.2 /100 | #266 | Tragic 5.1% |
| Immigrants | Bahamas | 0.2 /100 | #267 | Tragic 5.1% |
| Central American Indians | 0.2 /100 | #268 | Tragic 5.1% |
| Immigrants | Costa Rica | 0.2 /100 | #269 | Tragic 5.1% |
| Immigrants | Iran | 0.1 /100 | #270 | Tragic 5.1% |
| Israelis | 0.1 /100 | #271 | Tragic 5.2% |
| Haitians | 0.1 /100 | #272 | Tragic 5.2% |
| Immigrants | Spain | 0.1 /100 | #273 | Tragic 5.2% |
| Hopi | 0.1 /100 | #274 | Tragic 5.2% |
| Immigrants | Hong Kong | 0.1 /100 | #275 | Tragic 5.2% |
| Central Americans | 0.0 /100 | #276 | Tragic 5.2% |
Demographics Similar to Luxembourgers by Unemployment Among Ages 60 to 64 years
In terms of unemployment among ages 60 to 64 years, the demographic groups most similar to Luxembourgers are Immigrants from Bosnia and Herzegovina (4.2%, a difference of 0.74%), Immigrants from Cuba (4.3%, a difference of 1.0%), Chickasaw (4.3%, a difference of 1.0%), Norwegian (4.3%, a difference of 1.1%), and Indonesian (4.2%, a difference of 1.1%).
| Demographics | Rating | Rank | Unemployment Among Ages 60 to 64 years |
| Hmong | 100.0 /100 | #4 | Exceptional 4.0% |
| Immigrants | Azores | 100.0 /100 | #5 | Exceptional 4.0% |
| Immigrants | Congo | 100.0 /100 | #6 | Exceptional 4.1% |
| Lumbee | 100.0 /100 | #7 | Exceptional 4.2% |
| Immigrants | Micronesia | 100.0 /100 | #8 | Exceptional 4.2% |
| Indonesians | 100.0 /100 | #9 | Exceptional 4.2% |
| Immigrants | Bosnia and Herzegovina | 100.0 /100 | #10 | Exceptional 4.2% |
| Luxembourgers | 100.0 /100 | #11 | Exceptional 4.3% |
| Immigrants | Cuba | 100.0 /100 | #12 | Exceptional 4.3% |
| Chickasaw | 100.0 /100 | #13 | Exceptional 4.3% |
| Norwegians | 100.0 /100 | #14 | Exceptional 4.3% |
| Sudanese | 100.0 /100 | #15 | Exceptional 4.3% |
| Danes | 100.0 /100 | #16 | Exceptional 4.4% |
| Immigrants | Afghanistan | 100.0 /100 | #17 | Exceptional 4.4% |
| Slovenes | 100.0 /100 | #18 | Exceptional 4.4% |