Irish vs Luxembourger Unemployment Among Ages 60 to 64 years
COMPARE
Irish
Luxembourger
Unemployment Among Ages 60 to 64 years
Unemployment Among Ages 60 to 64 years Comparison
Irish
Luxembourgers
4.7%
UNEMPLOYMENT AMONG AGES 60 TO 64 YEARS
99.2/ 100
METRIC RATING
79th/ 347
METRIC RANK
4.3%
UNEMPLOYMENT AMONG AGES 60 TO 64 YEARS
100.0/ 100
METRIC RATING
11th/ 347
METRIC RANK
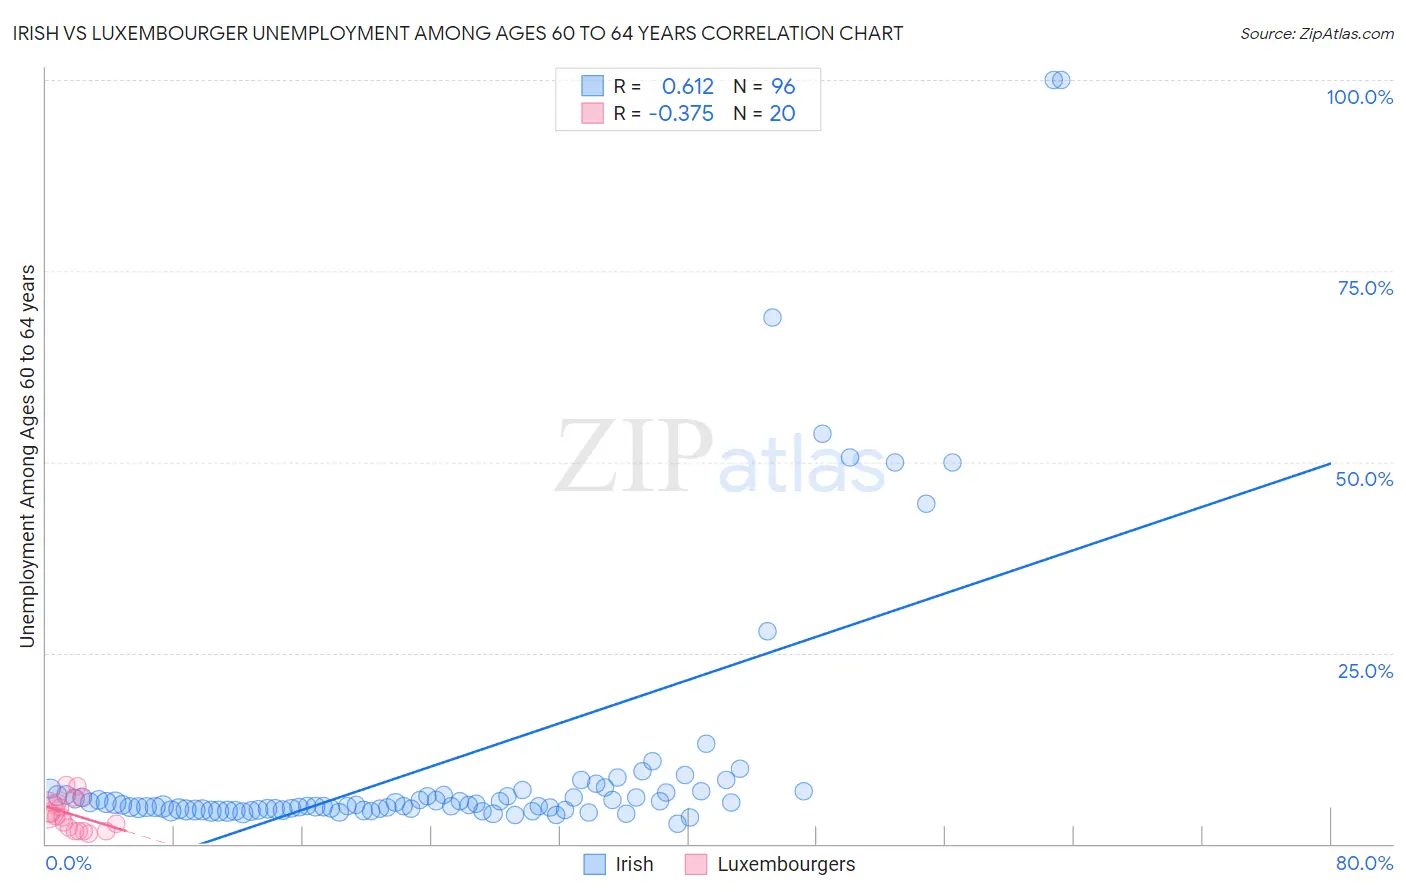
Irish vs Luxembourger Unemployment Among Ages 60 to 64 years Correlation Chart
The statistical analysis conducted on geographies consisting of 468,149,773 people shows a significant positive correlation between the proportion of Irish and unemployment rate among population between the ages 60 and 64 in the United States with a correlation coefficient (R) of 0.612 and weighted average of 4.7%. Similarly, the statistical analysis conducted on geographies consisting of 136,276,430 people shows a mild negative correlation between the proportion of Luxembourgers and unemployment rate among population between the ages 60 and 64 in the United States with a correlation coefficient (R) of -0.375 and weighted average of 4.3%, a difference of 8.7%.
Unemployment Among Ages 60 to 64 years Correlation Summary
| Measurement | Irish | Luxembourger |
| Minimum | 2.6% | 1.3% |
| Maximum | 100.0% | 7.6% |
| Range | 97.4% | 6.3% |
| Mean | 10.7% | 3.9% |
| Median | 5.1% | 3.8% |
| Interquartile 25% (IQ1) | 4.5% | 1.9% |
| Interquartile 75% (IQ3) | 6.6% | 5.4% |
| Interquartile Range (IQR) | 2.1% | 3.5% |
| Standard Deviation (Sample) | 17.7% | 2.0% |
| Standard Deviation (Population) | 17.7% | 1.9% |
Similar Demographics by Unemployment Among Ages 60 to 64 years
Demographics Similar to Irish by Unemployment Among Ages 60 to 64 years
In terms of unemployment among ages 60 to 64 years, the demographic groups most similar to Irish are Seminole (4.7%, a difference of 0.030%), Icelander (4.7%, a difference of 0.030%), Iroquois (4.7%, a difference of 0.040%), Okinawan (4.7%, a difference of 0.040%), and Immigrants from Egypt (4.7%, a difference of 0.050%).
| Demographics | Rating | Rank | Unemployment Among Ages 60 to 64 years |
| Tongans | 99.5 /100 | #72 | Exceptional 4.6% |
| Immigrants | Eastern Africa | 99.5 /100 | #73 | Exceptional 4.6% |
| Northern Europeans | 99.3 /100 | #74 | Exceptional 4.6% |
| Potawatomi | 99.3 /100 | #75 | Exceptional 4.6% |
| Slovaks | 99.3 /100 | #76 | Exceptional 4.6% |
| Immigrants | Somalia | 99.2 /100 | #77 | Exceptional 4.6% |
| Seminole | 99.2 /100 | #78 | Exceptional 4.7% |
| Irish | 99.2 /100 | #79 | Exceptional 4.7% |
| Icelanders | 99.1 /100 | #80 | Exceptional 4.7% |
| Iroquois | 99.1 /100 | #81 | Exceptional 4.7% |
| Okinawans | 99.1 /100 | #82 | Exceptional 4.7% |
| Immigrants | Egypt | 99.1 /100 | #83 | Exceptional 4.7% |
| Thais | 98.9 /100 | #84 | Exceptional 4.7% |
| Immigrants | Sri Lanka | 98.9 /100 | #85 | Exceptional 4.7% |
| Immigrants | Oceania | 98.9 /100 | #86 | Exceptional 4.7% |
Demographics Similar to Luxembourgers by Unemployment Among Ages 60 to 64 years
In terms of unemployment among ages 60 to 64 years, the demographic groups most similar to Luxembourgers are Immigrants from Bosnia and Herzegovina (4.2%, a difference of 0.74%), Immigrants from Cuba (4.3%, a difference of 1.0%), Chickasaw (4.3%, a difference of 1.0%), Norwegian (4.3%, a difference of 1.1%), and Indonesian (4.2%, a difference of 1.1%).
| Demographics | Rating | Rank | Unemployment Among Ages 60 to 64 years |
| Hmong | 100.0 /100 | #4 | Exceptional 4.0% |
| Immigrants | Azores | 100.0 /100 | #5 | Exceptional 4.0% |
| Immigrants | Congo | 100.0 /100 | #6 | Exceptional 4.1% |
| Lumbee | 100.0 /100 | #7 | Exceptional 4.2% |
| Immigrants | Micronesia | 100.0 /100 | #8 | Exceptional 4.2% |
| Indonesians | 100.0 /100 | #9 | Exceptional 4.2% |
| Immigrants | Bosnia and Herzegovina | 100.0 /100 | #10 | Exceptional 4.2% |
| Luxembourgers | 100.0 /100 | #11 | Exceptional 4.3% |
| Immigrants | Cuba | 100.0 /100 | #12 | Exceptional 4.3% |
| Chickasaw | 100.0 /100 | #13 | Exceptional 4.3% |
| Norwegians | 100.0 /100 | #14 | Exceptional 4.3% |
| Sudanese | 100.0 /100 | #15 | Exceptional 4.3% |
| Danes | 100.0 /100 | #16 | Exceptional 4.4% |
| Immigrants | Afghanistan | 100.0 /100 | #17 | Exceptional 4.4% |
| Slovenes | 100.0 /100 | #18 | Exceptional 4.4% |