Immigrants from Costa Rica vs Alaska Native Male Unemployment
COMPARE
Immigrants from Costa Rica
Alaska Native
Male Unemployment
Male Unemployment Comparison
Immigrants from Costa Rica
Alaska Natives
5.5%
MALE UNEMPLOYMENT
11.4/ 100
METRIC RATING
205th/ 347
METRIC RANK
8.1%
MALE UNEMPLOYMENT
0.0/ 100
METRIC RATING
331st/ 347
METRIC RANK
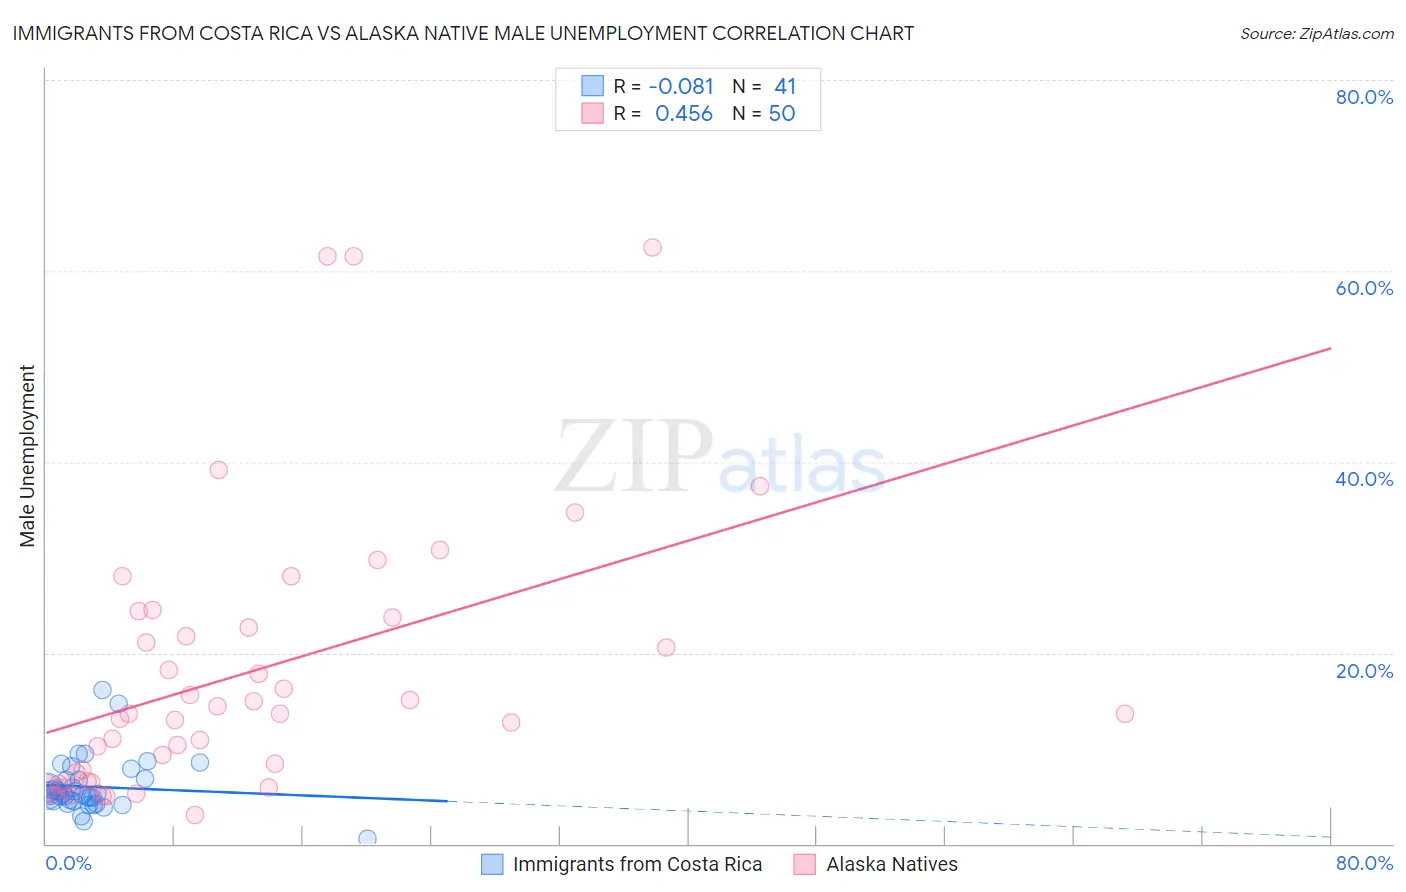
Immigrants from Costa Rica vs Alaska Native Male Unemployment Correlation Chart
The statistical analysis conducted on geographies consisting of 204,074,959 people shows a slight negative correlation between the proportion of Immigrants from Costa Rica and unemployment rate among males in the United States with a correlation coefficient (R) of -0.081 and weighted average of 5.5%. Similarly, the statistical analysis conducted on geographies consisting of 76,676,462 people shows a moderate positive correlation between the proportion of Alaska Natives and unemployment rate among males in the United States with a correlation coefficient (R) of 0.456 and weighted average of 8.1%, a difference of 48.2%.
Male Unemployment Correlation Summary
| Measurement | Immigrants from Costa Rica | Alaska Native |
| Minimum | 0.50% | 3.0% |
| Maximum | 16.0% | 62.5% |
| Range | 15.5% | 59.5% |
| Mean | 6.0% | 18.1% |
| Median | 5.3% | 13.6% |
| Interquartile 25% (IQ1) | 4.5% | 7.5% |
| Interquartile 75% (IQ3) | 6.8% | 23.7% |
| Interquartile Range (IQR) | 2.3% | 16.2% |
| Standard Deviation (Sample) | 2.8% | 14.4% |
| Standard Deviation (Population) | 2.8% | 14.3% |
Similar Demographics by Male Unemployment
Demographics Similar to Immigrants from Costa Rica by Male Unemployment
In terms of male unemployment, the demographic groups most similar to Immigrants from Costa Rica are Guamanian/Chamorro (5.4%, a difference of 0.13%), Immigrants from Laos (5.4%, a difference of 0.22%), Immigrants from Ukraine (5.5%, a difference of 0.22%), Nonimmigrants (5.4%, a difference of 0.23%), and Immigrants from Philippines (5.4%, a difference of 0.27%).
| Demographics | Rating | Rank | Male Unemployment |
| Immigrants | Thailand | 14.7 /100 | #198 | Poor 5.4% |
| Immigrants | Greece | 14.5 /100 | #199 | Poor 5.4% |
| Immigrants | Zaire | 13.7 /100 | #200 | Poor 5.4% |
| Immigrants | Philippines | 13.5 /100 | #201 | Poor 5.4% |
| Immigrants | Nonimmigrants | 13.1 /100 | #202 | Poor 5.4% |
| Immigrants | Laos | 13.0 /100 | #203 | Poor 5.4% |
| Guamanians/Chamorros | 12.3 /100 | #204 | Poor 5.4% |
| Immigrants | Costa Rica | 11.4 /100 | #205 | Poor 5.5% |
| Immigrants | Ukraine | 9.9 /100 | #206 | Tragic 5.5% |
| Immigrants | Syria | 9.3 /100 | #207 | Tragic 5.5% |
| Immigrants | Lebanon | 8.6 /100 | #208 | Tragic 5.5% |
| Immigrants | Middle Africa | 8.3 /100 | #209 | Tragic 5.5% |
| South American Indians | 7.6 /100 | #210 | Tragic 5.5% |
| Israelis | 7.4 /100 | #211 | Tragic 5.5% |
| Hmong | 7.0 /100 | #212 | Tragic 5.5% |
Demographics Similar to Alaska Natives by Male Unemployment
In terms of male unemployment, the demographic groups most similar to Alaska Natives are Yakama (7.9%, a difference of 1.9%), Pima (8.3%, a difference of 2.4%), Immigrants from Yemen (7.8%, a difference of 3.7%), Sioux (8.4%, a difference of 3.7%), and Native/Alaskan (7.7%, a difference of 4.7%).
| Demographics | Rating | Rank | Male Unemployment |
| Dominicans | 0.0 /100 | #324 | Tragic 7.6% |
| Shoshone | 0.0 /100 | #325 | Tragic 7.6% |
| Immigrants | Dominican Republic | 0.0 /100 | #326 | Tragic 7.6% |
| Paiute | 0.0 /100 | #327 | Tragic 7.7% |
| Natives/Alaskans | 0.0 /100 | #328 | Tragic 7.7% |
| Immigrants | Yemen | 0.0 /100 | #329 | Tragic 7.8% |
| Yakama | 0.0 /100 | #330 | Tragic 7.9% |
| Alaska Natives | 0.0 /100 | #331 | Tragic 8.1% |
| Pima | 0.0 /100 | #332 | Tragic 8.3% |
| Sioux | 0.0 /100 | #333 | Tragic 8.4% |
| Tsimshian | 0.0 /100 | #334 | Tragic 8.5% |
| Pueblo | 0.0 /100 | #335 | Tragic 8.5% |
| Yuman | 0.0 /100 | #336 | Tragic 8.6% |
| Puerto Ricans | 0.0 /100 | #337 | Tragic 8.6% |
| Apache | 0.0 /100 | #338 | Tragic 8.6% |