Immigrants from Congo vs British West Indian Unemployment Among Ages 55 to 59 years
COMPARE
Immigrants from Congo
British West Indian
Unemployment Among Ages 55 to 59 years
Unemployment Among Ages 55 to 59 years Comparison
Immigrants from Congo
British West Indians
4.3%
UNEMPLOYMENT AMONG AGES 55 TO 59 YEARS
100.0/ 100
METRIC RATING
11th/ 347
METRIC RANK
5.3%
UNEMPLOYMENT AMONG AGES 55 TO 59 YEARS
0.0/ 100
METRIC RATING
292nd/ 347
METRIC RANK
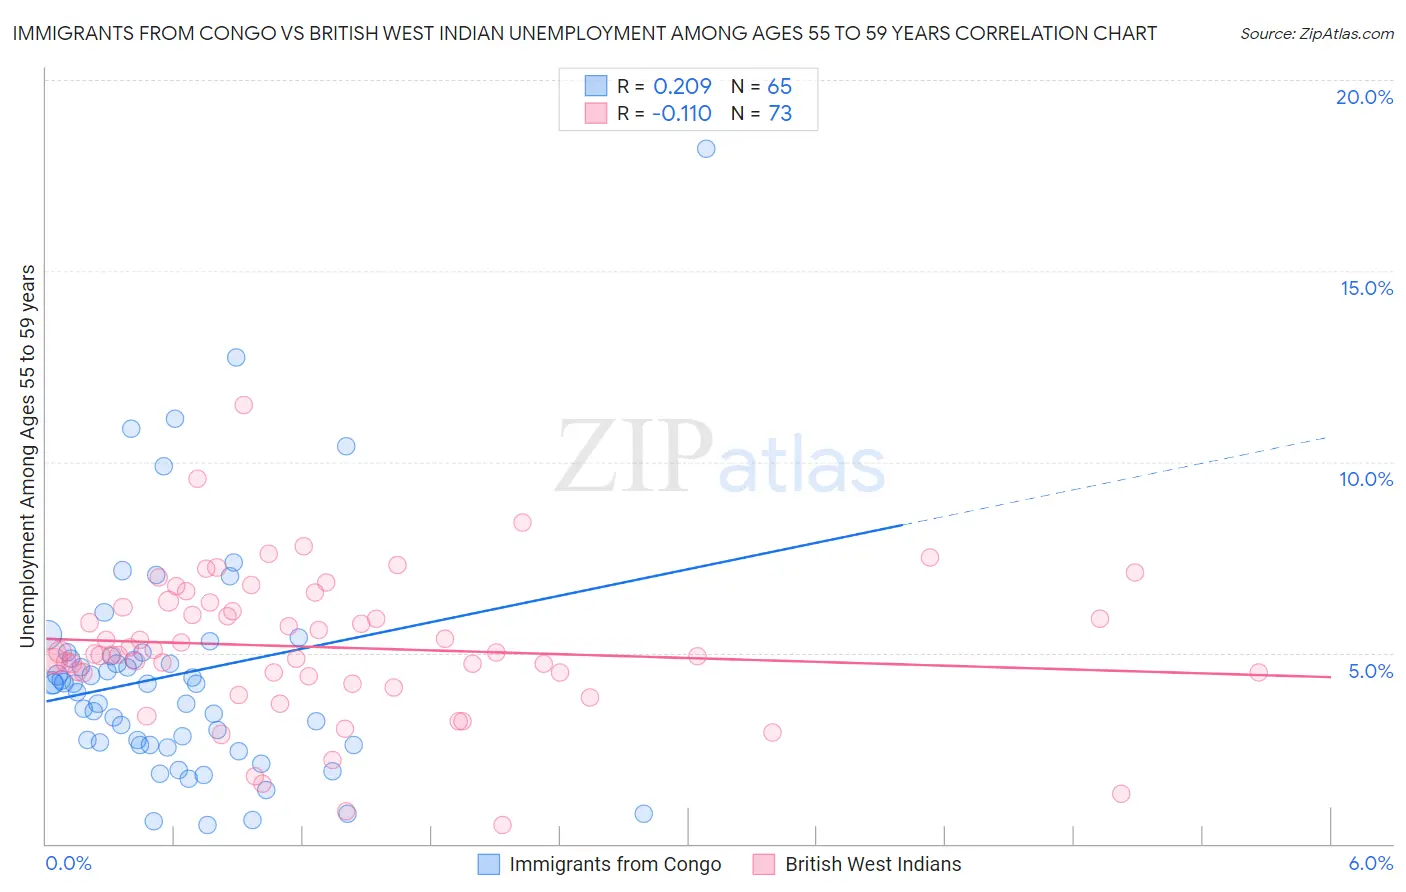
Immigrants from Congo vs British West Indian Unemployment Among Ages 55 to 59 years Correlation Chart
The statistical analysis conducted on geographies consisting of 90,603,220 people shows a weak positive correlation between the proportion of Immigrants from Congo and unemployment rate among population between the ages 55 and 59 in the United States with a correlation coefficient (R) of 0.209 and weighted average of 4.3%. Similarly, the statistical analysis conducted on geographies consisting of 148,255,971 people shows a poor negative correlation between the proportion of British West Indians and unemployment rate among population between the ages 55 and 59 in the United States with a correlation coefficient (R) of -0.110 and weighted average of 5.3%, a difference of 23.4%.
Unemployment Among Ages 55 to 59 years Correlation Summary
| Measurement | Immigrants from Congo | British West Indian |
| Minimum | 0.50% | 0.50% |
| Maximum | 18.2% | 11.5% |
| Range | 17.7% | 11.0% |
| Mean | 4.4% | 5.1% |
| Median | 4.2% | 5.0% |
| Interquartile 25% (IQ1) | 2.6% | 4.4% |
| Interquartile 75% (IQ3) | 5.0% | 6.3% |
| Interquartile Range (IQR) | 2.4% | 1.8% |
| Standard Deviation (Sample) | 3.1% | 1.9% |
| Standard Deviation (Population) | 3.1% | 1.9% |
Similar Demographics by Unemployment Among Ages 55 to 59 years
Demographics Similar to Immigrants from Congo by Unemployment Among Ages 55 to 59 years
In terms of unemployment among ages 55 to 59 years, the demographic groups most similar to Immigrants from Congo are Danish (4.3%, a difference of 0.19%), Indonesian (4.3%, a difference of 0.45%), Tongan (4.3%, a difference of 0.51%), Immigrants from India (4.3%, a difference of 0.61%), and Bulgarian (4.3%, a difference of 0.87%).
| Demographics | Rating | Rank | Unemployment Among Ages 55 to 59 years |
| Venezuelans | 100.0 /100 | #4 | Exceptional 4.2% |
| Immigrants | Bolivia | 100.0 /100 | #5 | Exceptional 4.2% |
| Norwegians | 100.0 /100 | #6 | Exceptional 4.2% |
| Zimbabweans | 100.0 /100 | #7 | Exceptional 4.2% |
| Bolivians | 100.0 /100 | #8 | Exceptional 4.2% |
| Cubans | 100.0 /100 | #9 | Exceptional 4.2% |
| Tongans | 100.0 /100 | #10 | Exceptional 4.3% |
| Immigrants | Congo | 100.0 /100 | #11 | Exceptional 4.3% |
| Danes | 100.0 /100 | #12 | Exceptional 4.3% |
| Indonesians | 100.0 /100 | #13 | Exceptional 4.3% |
| Immigrants | India | 100.0 /100 | #14 | Exceptional 4.3% |
| Bulgarians | 100.0 /100 | #15 | Exceptional 4.3% |
| Somalis | 100.0 /100 | #16 | Exceptional 4.4% |
| Czechs | 100.0 /100 | #17 | Exceptional 4.4% |
| Immigrants | Somalia | 100.0 /100 | #18 | Exceptional 4.4% |
Demographics Similar to British West Indians by Unemployment Among Ages 55 to 59 years
In terms of unemployment among ages 55 to 59 years, the demographic groups most similar to British West Indians are Trinidadian and Tobagonian (5.3%, a difference of 0.14%), Immigrants from Grenada (5.3%, a difference of 0.19%), Sioux (5.3%, a difference of 0.21%), Immigrants from Central America (5.3%, a difference of 0.24%), and Immigrants from Israel (5.3%, a difference of 0.30%).
| Demographics | Rating | Rank | Unemployment Among Ages 55 to 59 years |
| Armenians | 0.0 /100 | #285 | Tragic 5.3% |
| Immigrants | Ghana | 0.0 /100 | #286 | Tragic 5.3% |
| Immigrants | Guatemala | 0.0 /100 | #287 | Tragic 5.3% |
| Immigrants | Israel | 0.0 /100 | #288 | Tragic 5.3% |
| Immigrants | Central America | 0.0 /100 | #289 | Tragic 5.3% |
| Sioux | 0.0 /100 | #290 | Tragic 5.3% |
| Trinidadians and Tobagonians | 0.0 /100 | #291 | Tragic 5.3% |
| British West Indians | 0.0 /100 | #292 | Tragic 5.3% |
| Immigrants | Grenada | 0.0 /100 | #293 | Tragic 5.3% |
| Cajuns | 0.0 /100 | #294 | Tragic 5.3% |
| Dutch West Indians | 0.0 /100 | #295 | Tragic 5.3% |
| Barbadians | 0.0 /100 | #296 | Tragic 5.3% |
| Immigrants | Mexico | 0.0 /100 | #297 | Tragic 5.3% |
| Hispanics or Latinos | 0.0 /100 | #298 | Tragic 5.4% |
| Cape Verdeans | 0.0 /100 | #299 | Tragic 5.4% |