Immigrants from Africa vs Latvian Unemployment Among Ages 55 to 59 years
COMPARE
Immigrants from Africa
Latvian
Unemployment Among Ages 55 to 59 years
Unemployment Among Ages 55 to 59 years Comparison
Immigrants from Africa
Latvians
4.8%
UNEMPLOYMENT AMONG AGES 55 TO 59 YEARS
64.2/ 100
METRIC RATING
162nd/ 347
METRIC RANK
4.6%
UNEMPLOYMENT AMONG AGES 55 TO 59 YEARS
97.8/ 100
METRIC RATING
82nd/ 347
METRIC RANK
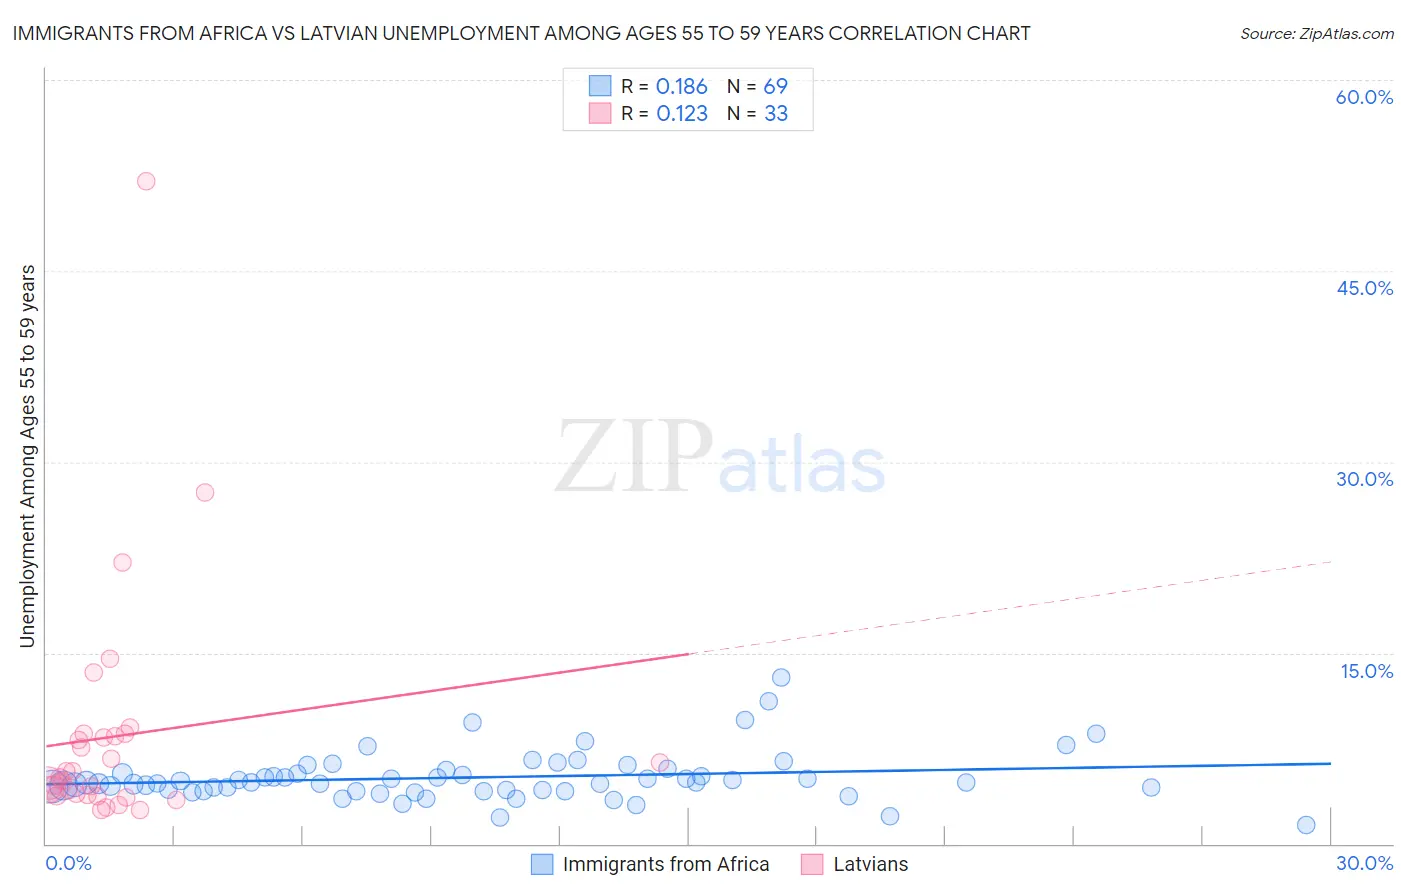
Immigrants from Africa vs Latvian Unemployment Among Ages 55 to 59 years Correlation Chart
The statistical analysis conducted on geographies consisting of 429,302,225 people shows a poor positive correlation between the proportion of Immigrants from Africa and unemployment rate among population between the ages 55 and 59 in the United States with a correlation coefficient (R) of 0.186 and weighted average of 4.8%. Similarly, the statistical analysis conducted on geographies consisting of 211,251,684 people shows a poor positive correlation between the proportion of Latvians and unemployment rate among population between the ages 55 and 59 in the United States with a correlation coefficient (R) of 0.123 and weighted average of 4.6%, a difference of 3.4%.
Unemployment Among Ages 55 to 59 years Correlation Summary
| Measurement | Immigrants from Africa | Latvian |
| Minimum | 1.5% | 2.7% |
| Maximum | 13.1% | 52.1% |
| Range | 11.6% | 49.4% |
| Mean | 5.2% | 8.4% |
| Median | 4.8% | 5.2% |
| Interquartile 25% (IQ1) | 4.2% | 3.8% |
| Interquartile 75% (IQ3) | 5.7% | 8.5% |
| Interquartile Range (IQR) | 1.5% | 4.8% |
| Standard Deviation (Sample) | 1.9% | 9.5% |
| Standard Deviation (Population) | 1.9% | 9.4% |
Similar Demographics by Unemployment Among Ages 55 to 59 years
Demographics Similar to Immigrants from Africa by Unemployment Among Ages 55 to 59 years
In terms of unemployment among ages 55 to 59 years, the demographic groups most similar to Immigrants from Africa are Korean (4.8%, a difference of 0.020%), Immigrants from Lebanon (4.8%, a difference of 0.020%), Immigrants from Nicaragua (4.8%, a difference of 0.040%), Chickasaw (4.8%, a difference of 0.040%), and American (4.8%, a difference of 0.040%).
| Demographics | Rating | Rank | Unemployment Among Ages 55 to 59 years |
| Immigrants | North Macedonia | 66.3 /100 | #155 | Good 4.8% |
| Italians | 66.2 /100 | #156 | Good 4.8% |
| Carpatho Rusyns | 66.0 /100 | #157 | Good 4.8% |
| Slovaks | 65.3 /100 | #158 | Good 4.8% |
| Immigrants | Nicaragua | 65.2 /100 | #159 | Good 4.8% |
| Chickasaw | 65.1 /100 | #160 | Good 4.8% |
| Koreans | 64.6 /100 | #161 | Good 4.8% |
| Immigrants | Africa | 64.2 /100 | #162 | Good 4.8% |
| Immigrants | Lebanon | 63.8 /100 | #163 | Good 4.8% |
| Americans | 63.3 /100 | #164 | Good 4.8% |
| Immigrants | France | 62.0 /100 | #165 | Good 4.8% |
| Potawatomi | 62.0 /100 | #166 | Good 4.8% |
| Immigrants | Western Europe | 60.4 /100 | #167 | Good 4.8% |
| Immigrants | Cambodia | 59.3 /100 | #168 | Average 4.8% |
| Immigrants | Sudan | 58.4 /100 | #169 | Average 4.8% |
Demographics Similar to Latvians by Unemployment Among Ages 55 to 59 years
In terms of unemployment among ages 55 to 59 years, the demographic groups most similar to Latvians are Taiwanese (4.6%, a difference of 0.050%), Cambodian (4.6%, a difference of 0.12%), Lebanese (4.6%, a difference of 0.12%), Sri Lankan (4.6%, a difference of 0.16%), and Finnish (4.6%, a difference of 0.25%).
| Demographics | Rating | Rank | Unemployment Among Ages 55 to 59 years |
| Immigrants | Iraq | 98.5 /100 | #75 | Exceptional 4.6% |
| Immigrants | Bosnia and Herzegovina | 98.3 /100 | #76 | Exceptional 4.6% |
| Scotch-Irish | 98.3 /100 | #77 | Exceptional 4.6% |
| Finns | 98.2 /100 | #78 | Exceptional 4.6% |
| Sri Lankans | 98.1 /100 | #79 | Exceptional 4.6% |
| Cambodians | 98.0 /100 | #80 | Exceptional 4.6% |
| Taiwanese | 97.9 /100 | #81 | Exceptional 4.6% |
| Latvians | 97.8 /100 | #82 | Exceptional 4.6% |
| Lebanese | 97.5 /100 | #83 | Exceptional 4.6% |
| Malaysians | 96.9 /100 | #84 | Exceptional 4.7% |
| Immigrants | Vietnam | 96.9 /100 | #85 | Exceptional 4.7% |
| Immigrants | Colombia | 96.9 /100 | #86 | Exceptional 4.7% |
| Poles | 96.9 /100 | #87 | Exceptional 4.7% |
| Immigrants | Cameroon | 96.9 /100 | #88 | Exceptional 4.7% |
| Irish | 96.8 /100 | #89 | Exceptional 4.7% |