Immigrants from Congo vs Delaware Unemployment
COMPARE
Immigrants from Congo
Delaware
Unemployment
Unemployment Comparison
Immigrants from Congo
Delaware
5.3%
UNEMPLOYMENT
50.0/ 100
METRIC RATING
174th/ 347
METRIC RANK
5.4%
UNEMPLOYMENT
14.7/ 100
METRIC RATING
215th/ 347
METRIC RANK
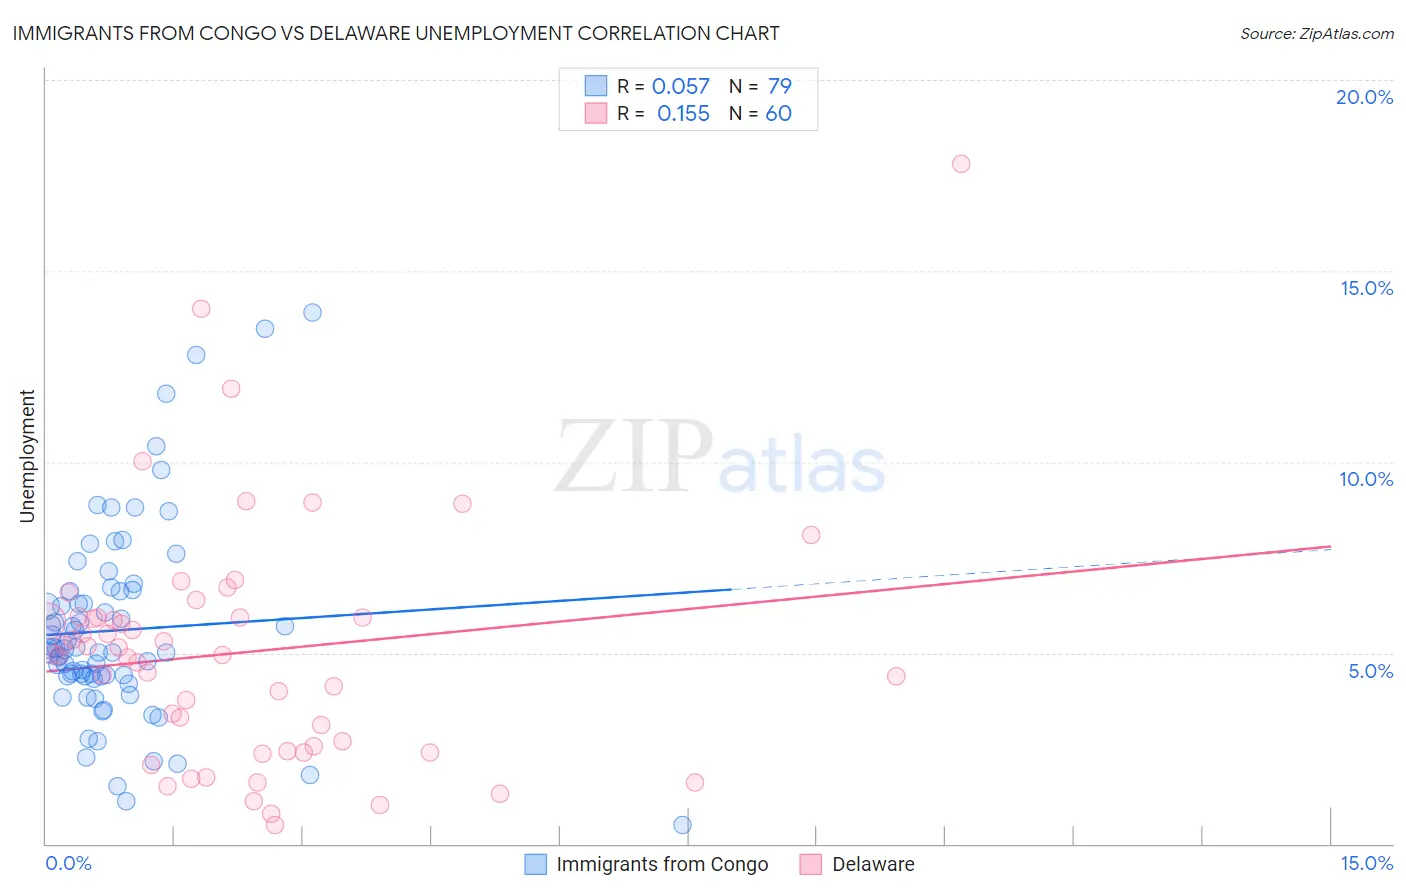
Immigrants from Congo vs Delaware Unemployment Correlation Chart
The statistical analysis conducted on geographies consisting of 92,111,963 people shows a slight positive correlation between the proportion of Immigrants from Congo and unemployment in the United States with a correlation coefficient (R) of 0.057 and weighted average of 5.3%. Similarly, the statistical analysis conducted on geographies consisting of 96,217,078 people shows a poor positive correlation between the proportion of Delaware and unemployment in the United States with a correlation coefficient (R) of 0.155 and weighted average of 5.4%, a difference of 2.7%.
Unemployment Correlation Summary
| Measurement | Immigrants from Congo | Delaware |
| Minimum | 0.50% | 0.50% |
| Maximum | 13.9% | 17.8% |
| Range | 13.4% | 17.3% |
| Mean | 5.6% | 5.0% |
| Median | 5.1% | 5.0% |
| Interquartile 25% (IQ1) | 4.4% | 2.5% |
| Interquartile 75% (IQ3) | 6.6% | 5.9% |
| Interquartile Range (IQR) | 2.2% | 3.4% |
| Standard Deviation (Sample) | 2.6% | 3.2% |
| Standard Deviation (Population) | 2.6% | 3.2% |
Similar Demographics by Unemployment
Demographics Similar to Immigrants from Congo by Unemployment
In terms of unemployment, the demographic groups most similar to Immigrants from Congo are Taiwanese (5.3%, a difference of 0.020%), Nicaraguan (5.3%, a difference of 0.080%), Immigrants from Poland (5.3%, a difference of 0.11%), Nonimmigrants (5.3%, a difference of 0.13%), and Immigrants from Vietnam (5.2%, a difference of 0.15%).
| Demographics | Rating | Rank | Unemployment |
| Colombians | 61.1 /100 | #167 | Good 5.2% |
| Uruguayans | 60.2 /100 | #168 | Good 5.2% |
| Immigrants | Morocco | 59.1 /100 | #169 | Average 5.2% |
| Immigrants | Nicaragua | 57.1 /100 | #170 | Average 5.2% |
| Puget Sound Salish | 56.6 /100 | #171 | Average 5.2% |
| Immigrants | Vietnam | 52.5 /100 | #172 | Average 5.2% |
| Immigrants | Poland | 51.8 /100 | #173 | Average 5.3% |
| Immigrants | Congo | 50.0 /100 | #174 | Average 5.3% |
| Taiwanese | 49.6 /100 | #175 | Average 5.3% |
| Nicaraguans | 48.7 /100 | #176 | Average 5.3% |
| Immigrants | Nonimmigrants | 47.9 /100 | #177 | Average 5.3% |
| Afghans | 47.4 /100 | #178 | Average 5.3% |
| Malaysians | 46.8 /100 | #179 | Average 5.3% |
| Immigrants | Greece | 45.0 /100 | #180 | Average 5.3% |
| Albanians | 43.5 /100 | #181 | Average 5.3% |
Demographics Similar to Delaware by Unemployment
In terms of unemployment, the demographic groups most similar to Delaware are Immigrants from Middle Africa (5.4%, a difference of 0.060%), Immigrants from Costa Rica (5.4%, a difference of 0.060%), Immigrants from South America (5.4%, a difference of 0.16%), Immigrants from Albania (5.4%, a difference of 0.16%), and Choctaw (5.4%, a difference of 0.26%).
| Demographics | Rating | Rank | Unemployment |
| Portuguese | 19.0 /100 | #208 | Poor 5.4% |
| Immigrants | Iran | 18.8 /100 | #209 | Poor 5.4% |
| Immigrants | Iraq | 18.6 /100 | #210 | Poor 5.4% |
| Iraqis | 18.1 /100 | #211 | Poor 5.4% |
| Ugandans | 18.0 /100 | #212 | Poor 5.4% |
| Immigrants | Middle Africa | 15.3 /100 | #213 | Poor 5.4% |
| Immigrants | Costa Rica | 15.2 /100 | #214 | Poor 5.4% |
| Delaware | 14.7 /100 | #215 | Poor 5.4% |
| Immigrants | South America | 13.5 /100 | #216 | Poor 5.4% |
| Immigrants | Albania | 13.5 /100 | #217 | Poor 5.4% |
| Choctaw | 12.7 /100 | #218 | Poor 5.4% |
| Bangladeshis | 11.2 /100 | #219 | Poor 5.4% |
| Soviet Union | 10.6 /100 | #220 | Poor 5.4% |
| Immigrants | Philippines | 10.4 /100 | #221 | Poor 5.4% |
| Iroquois | 10.3 /100 | #222 | Poor 5.4% |